Forex Blog

EUR/NZD Chart Analysis

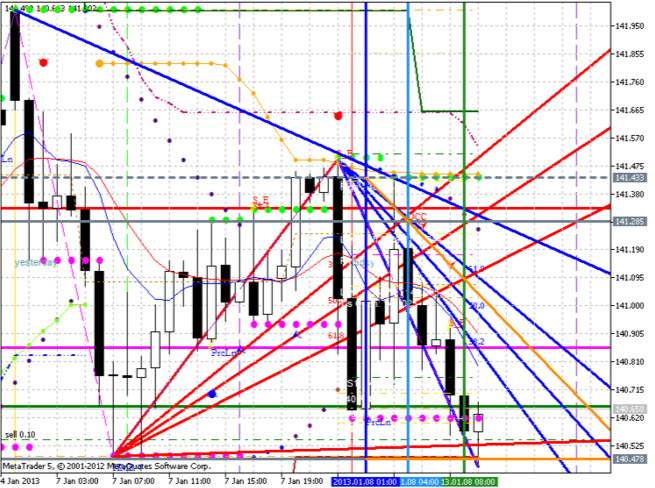
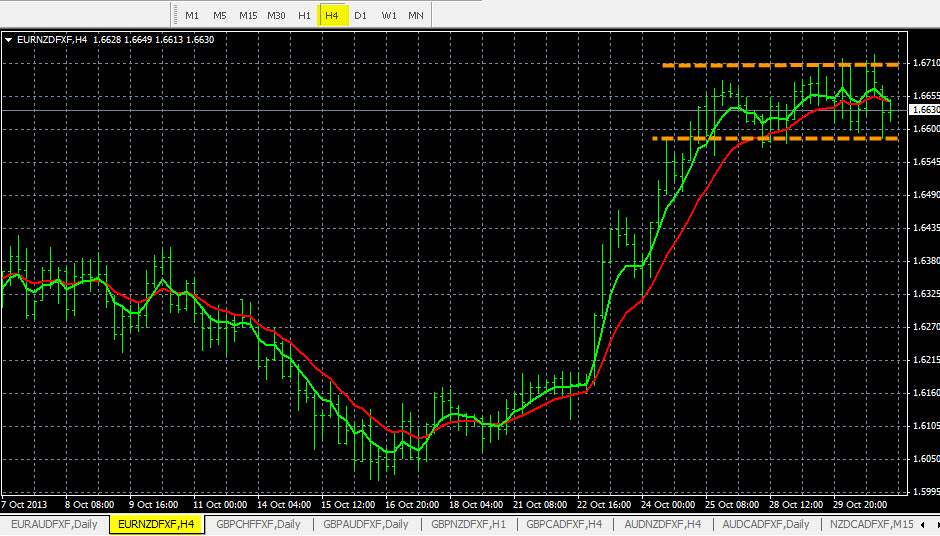
The EUR/NZD chart analysis is shown below for the H4 time frame. The EUR/NZD is currently consolidating inside of a price range. We are setting price alerts on either side of the support and resistance cluster to detect movement and to detect when this pair will form a new trend going in either direction. The alert points are shown by the yellow lines on the chart you see. This is called a straddle alert.

There is very good pip potential past both price alert points in either direction, and you can see the pip potential on the chart image below. If this pair falls it has as much as 500 pips of potential to the next support. When the price alert hits check the The Forex Heatmap ® for consistent EUR or NZD strength or weakness to verify the buy or sell.

EUR/NZD Chart Analysis

EUR/NZD Chart Analysis

When a currency pair is inside of a cluster on any of the larger time frames, it is best to not trade that pair. You should set price alerts on either side of the cluster to detect a breakout in either direction, especially when the pip potential is large, like in the example above. This technique works on any pair. When the price alert hits you can always check The Forex Heatmap® forex heatmap to verify any trade entries. By trading 28 pairs you can avoid clusters and move to another pair or another currency until this pair breaks out in either direction.

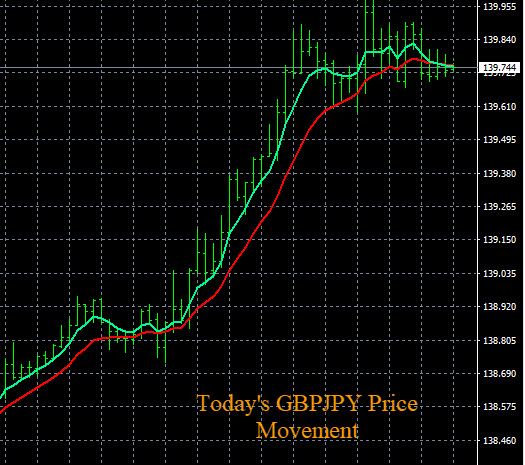
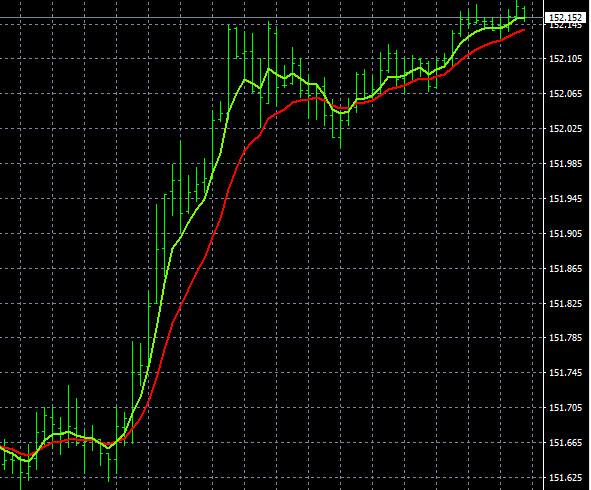
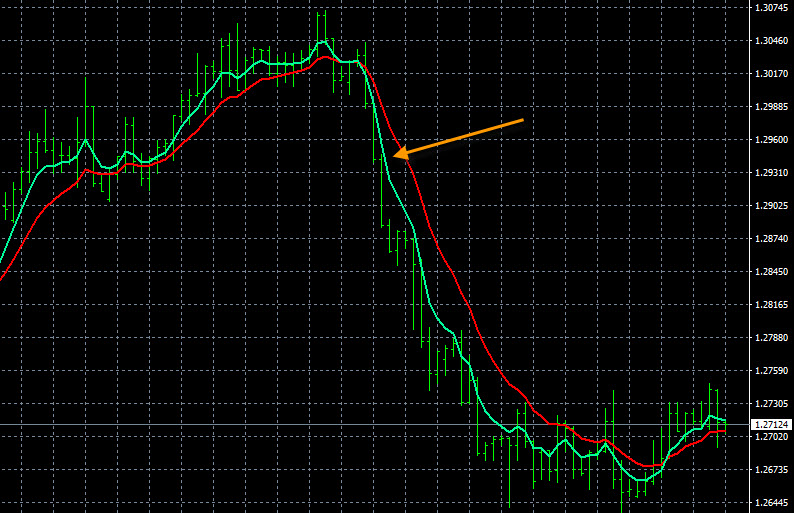
These forex indicators for monitoring trends are a very simple and easy to set up charting system. Traders can use them to perform their market analysis. They are exponential moving averages set up on a 5 and 12 time period.

Metatrader 4 Setup: Forex Trend Analysis

In this article we will show forex traders a great Metatrader 4 setup for forex trend analysis and how to monitor 28 pairs and 8 currencies for price breakouts. We will show traders how to set up the charts by individual currency. This will provide all forex traders with the best Metatrader setup for trend trading, determining what currencies are weak or strong, and knowing what pairs have the most potential for pips.

Download Metatrader 4

Start by downloading Metatrader 4 to your laptop or desktop computer. We recommend contacting your forex broker or looking on their website for their exact instructions. Instructions for downloading MT4 might vary from broker to broker. Your broker should have downloadable Metatrader 4 versions for windows, Mac OS or Linux operating systems.

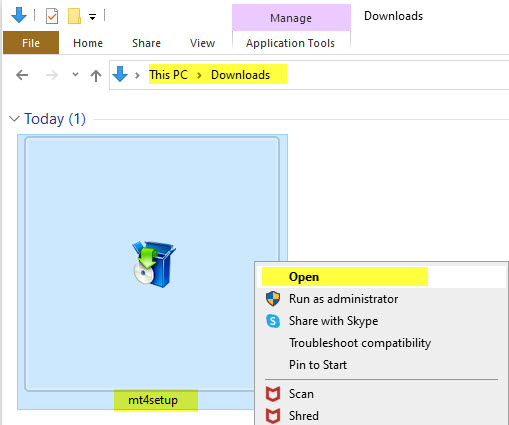
MT4 can be downloaded using several web browsers, including Internet Explorer, Google Chrome and Mozilla Firefox. Regardless of which browser you use, follow the steps on the broker website. For windows operating system you will download the controller from the broker website then open it to install Metatrader 4 on your hard drive.

Download Metatrader 4

Download Metatrader 4

These instructions are for MT4 setup on laptop or desktop computers. Most brokers also have App store or Google play mobile versions to setup Metatrader on your mobile device or phone.

Metatrader 4 Setup For Trend Analysis

After you download Metatrader 4 you can remove any default charts on your screen. Open up 28 charts for all pairs comprised of the 8 most liquid currencies. This would be the USD, CAD, EUR, GBP, CHF, JPY, AUD and NZD pairs. 28 pairs total. Now install some exponential moving averages based on the 5 and 12 time periods. These exponential moving averages will be used for trend analysis. Check the complete setup instructions for the forex trend indicators and your charts should now look like the one shown below:

Metatrader 4 Setup Trend Analysis

Metatrader 4 Setup Trend Analysis

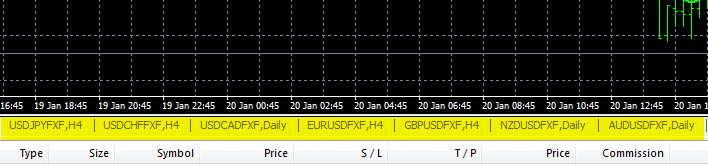
These are very simple trend indicators, but become very powerful when set up by individual currency. So next step is to group the pairs by individual currency. There should be 7 pairs in each group. For example, group all of the EUR pairs together side by side. The EUR/USD, EUR/JPY, EUR/CAD, etc. should be grouped side by side. You can also use the metatrader profiles for the individual currency setup if you like. The bottom tray on Metatrader should look like the image below for the EUR pairs. Then repeat this process for the top 8 most liquid currencies.

Metatrader 4 Setup For Trend Analysis

Metatrader 4 Setup For Trend Analysis

Why Setup Metatrader 4 Charts By Individual Currency?

In the case of the EUR pairs, so you can tell if the EUR is consistently strong or weak so you know when to trade these pairs, and in which direction. Example: If the H4 or D1 time frame is pointing down on all 7 EUR pairs listed, you know the EUR is weak and driving the movement. If the EUR pairs are mixed just go to the next currency. Since you can set up your charts this way for 8 currencies there is usually something trending up or down every week. You can learn more about the fundamental principles behind this setup for forex market analysis with parallel and inverse groups of pairs, it works and is powerful! Forex traders always say they are looking for an edge in their forex trading. Setting up your trend charts this way by individual currency will give you that edge and open up 28 pairs to your potential trade horizon, with lots more pips.

How to Analyze Individual Currencies With Metatrader 4

After Metatrader 4 is set up by individual currency. You can begin analyzing individual currencies for consistent strength or weakness, along with setting up some accurate trading plans. For this daily task you can utilize our forex market analysis spreadsheet. For example, if all of the JPY pairs are pointing up on the D1 time frames, you know that the JPY is weak. Then you can set trading plans to buy these pairs, estimate the price targets, and set price alerts for the breakouts.  When the price alerts hit you can verify any buys with The Forex Heatmap® like the example trade above.  This process works for the top 8 currencies we follow.

Metatrader Setup Trend Analysis

Metatrader Setup Trend Analysis

Metatrader 4 Setup For Price Breakouts

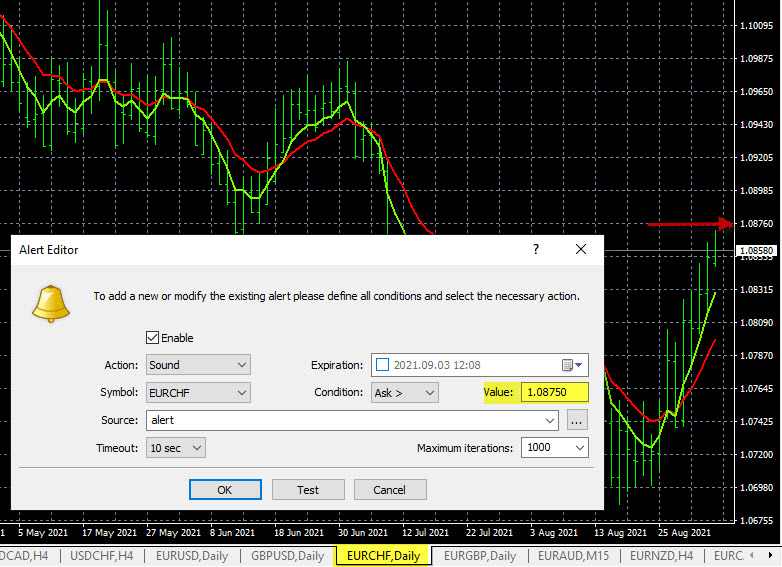
Now that you have your trend indicators set up for trend analysis lets setup the same charts to monitor for price breakouts in both directions on any time frame. Metatrader 4 has a price alert functionality that looks like the image below:

Metatrader 4 Setup Price Breakouts

Metatrader 4 Setup Price Breakouts

At the bottom of the Metatrader 4 screen click on the “Alerts” tab then set price breakout alerts in either direction on any pair just above or below the current pricing, if the pair is trending. When the alert goes off you will hear an audible alert that repeats until you shut it off. Traders can also set price alerts to monitor for price reversals, and for profit targets to scale out lots or exit trades. The Metatrader 4 price alert functionality is a fantastic tool for trend traders to monitor for price breakouts, and it works great for all traders. When the price alerts hit you can look at the procedures below to verify if you have a valid entry point. You can also check our illustrated article about price breakouts for more breakout examples.

How To Enter Forex Trades With MT4

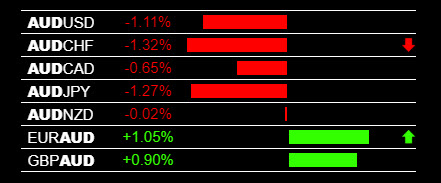
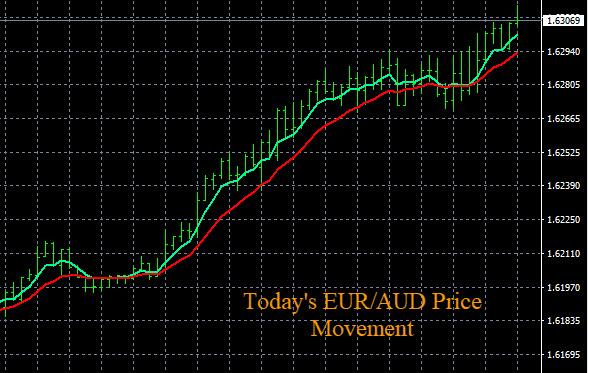
Now that you have your setup on Metatrader 4, we can review how to successfully enter trend based trades with this system. Example trade entry: A trader sets a price alert for the EUR/AUD for a resistance breakout.  Wait for the main trading session. The price alert goes off, then you must verify the buy trade entry on this pair.

Traders can use The Forex Heatmap® forex heatmap to verify their trade entry. In this case the AUD is weak and is driving the movement. You would use the smaller time frames and heatmap signals to verify the buy to enter the trends on the higher time frames, like the H4 time frame and larger.

Metatrader 4 Setup Signals

Metatrader 4 Setup Signals

Metatrader 4 Setup Chart

Metatrader 4 Setup Chart

This trade entry system using Metatrader 4 can be used for trend based trade entries, and for shorter term trades against the trend or on ranging pairs. This trade entry system can also be used for day trading. The system work very well for 8 currencies and 28 pairs.

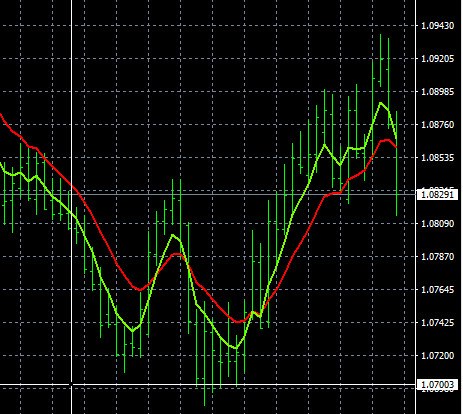
Traders can also manage trade exits with MT4. If a trader sells the EUR/CHF and this pair is hitting strong support, these levels can be clearly seen on Metatrader 4 using the support and resistance cross hairs. Activate the cross hairs to see that this pair has heavy support at the 1.0700 level. This is a profit taking point on any sell trades and possible reversal point back to the upside. Since you have your charts set up by individual currency you can check all of the EUR pairs support levels quickly using the support and resistance cross hairs.

Metatrader 4 Support Resistance Levels

Metatrader 4 Support Resistance Levels

Metatrader 4 Setup Videos

Our website is loaded with many illustrated articles and lessons. We also have a library of 10 videos to explain how to setup Metatrader 4. This includes basic chart setup and more setups using the Metatrader “profiles”. After reviewing more information on our website and also our videos,  you will have a full professional chart and indicators setup for market analysis and entering trades for 28 pairs. Our trading system works and is profitable.

Forex Candlesticks: Are They Effective For Traders

Forex candlestick charts are in wide use by forex traders, but how effective are they at helping traders to trade more profitably? The short answer is probalbly no. If used correctly we see a small amount of potential, but there are much more effective ways to analyze the forex market and set up your charts and indicators.

What Is A Forex Candlestick Chart

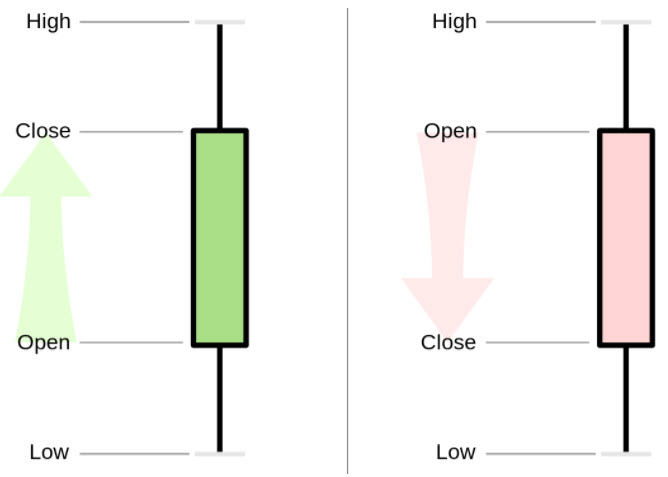
Forex candlestick chart patterns are a form of charting analysis used by forex traders to identify potential trading opportunities. Sometimes they are called forex candlestick charts or Japanese candlestick charts.

Forex Candlesticks

Forex Candlesticks

Most Commonly Used Forex Candlestick Patterns

Some of the most popular forex candlestick patterns include the doji family, tweezer tops / tweezer bottoms, the hammer family, three inside ups / three inside downs, evening star / morning star. In total there are around 50 recognized forex candlestick patterns. If you combine these 50 candlestick patterns with 9 time frames most traders use, you start to see potential problems developing for their use. For example, what is the best time frame to use candlesticks on?, and why. Some candlestick patterns are considered bullish or bearish, but this is only for a few pips on the smaller time frames, on one or two pairs, with high risk. Much better chart setups are available for traders without candlesticks to make strong profits with lots of confidence at the point of entry.

How Do Forex Traders Use Candlesticks

Typically, forex traders don’t have much of a strategy for using candlesticks. They simply do what is convenient, then suffer the consequences. They set up candlesticks on one currency pair, then use popular candlestick chart patterns for entering trades on one or maybe two pairs. Almost all forex traders who use candlesticks do this. Forex traders use candlesticks because they see other traders using them and they have not researched other options which are much better. Their approach to using candlesticks is random.

Randomness does not account for any momentum in the individual currencies in each pair and will never result in more than a few pips on any one trade entry. The risk of doing this is too high with almost no pips in return. The reward versus risk in unacceptable. Traders defaulting to scalping the smaller time frames will be the result. Any positive pips on any trade will be random results, considering that there are over 50 candlestick patterns and 9 time frames or more. There is no upside or advantage of using candlesticks in this manner.

Do Forex Traders Need To Use Candlesticks

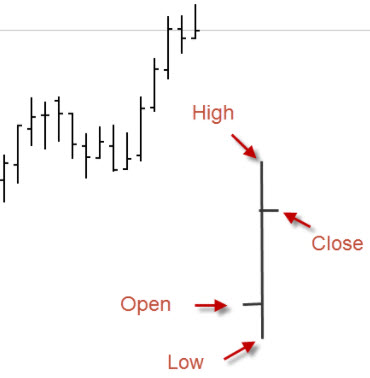
Forex traders do not need to use candlesticks, if forex traders used barcharts (open, high, low charts) without the candles, then set the barcharts up the way we show you to below, candlesticks would not be necessary at all. Candlesticks offer no advantage to forex traders, not even a few pips of profit advantage.

Barcharts Versus Candlesticks

Barcharts Versus Candlesticks

Barcharts give you the same information as candlesticks, so in this regard candlesticks have no advantage at all. They provide a different visual look, but if you attach barcharts or candlesticks to individual pairs you will still fail as a forex trader because you have no confirmation of the trade entry.

Are There Better Alternatives To Candlesticks

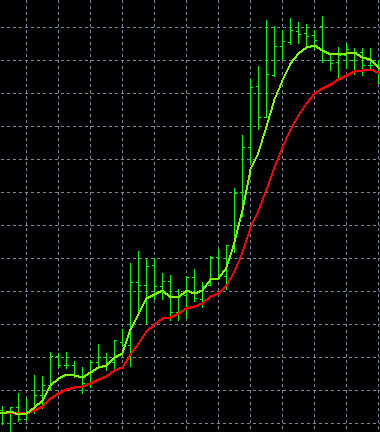
Yes most definitely so. We suggest setting up barcharts instead of candlesticks. Next step would be to install some exponential moving average trend indicators with the barcharts across 28 different pairs. After that rearrange the charts by individual currency. Using this plan for chart setup you would group all of the USD pairs together, then all of the CAD pairs together, etc. and repeat the process for the top 8 most liquid currencies.

Barcharts With Moving Averages

Barcharts With Moving Averages

Why would you group the pairs together with one common currency? Because, for example if all of the EUR pairs are trending up on the D1 time frame, you know that the EUR is strong and you can buy one of the EUR pairs. In some cases, you can trade all of them based on EUR strength. If you do this across 8 currencies you are starting to build a powerful trading system for currencies across 28 pairs, without any candlestick charts.

Example Trade Without Candlesticks

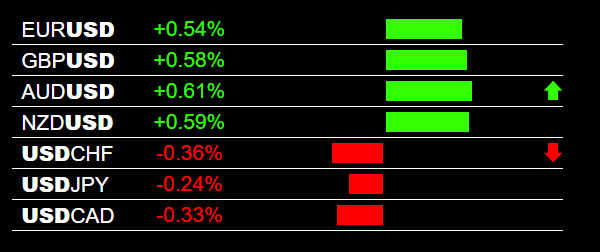
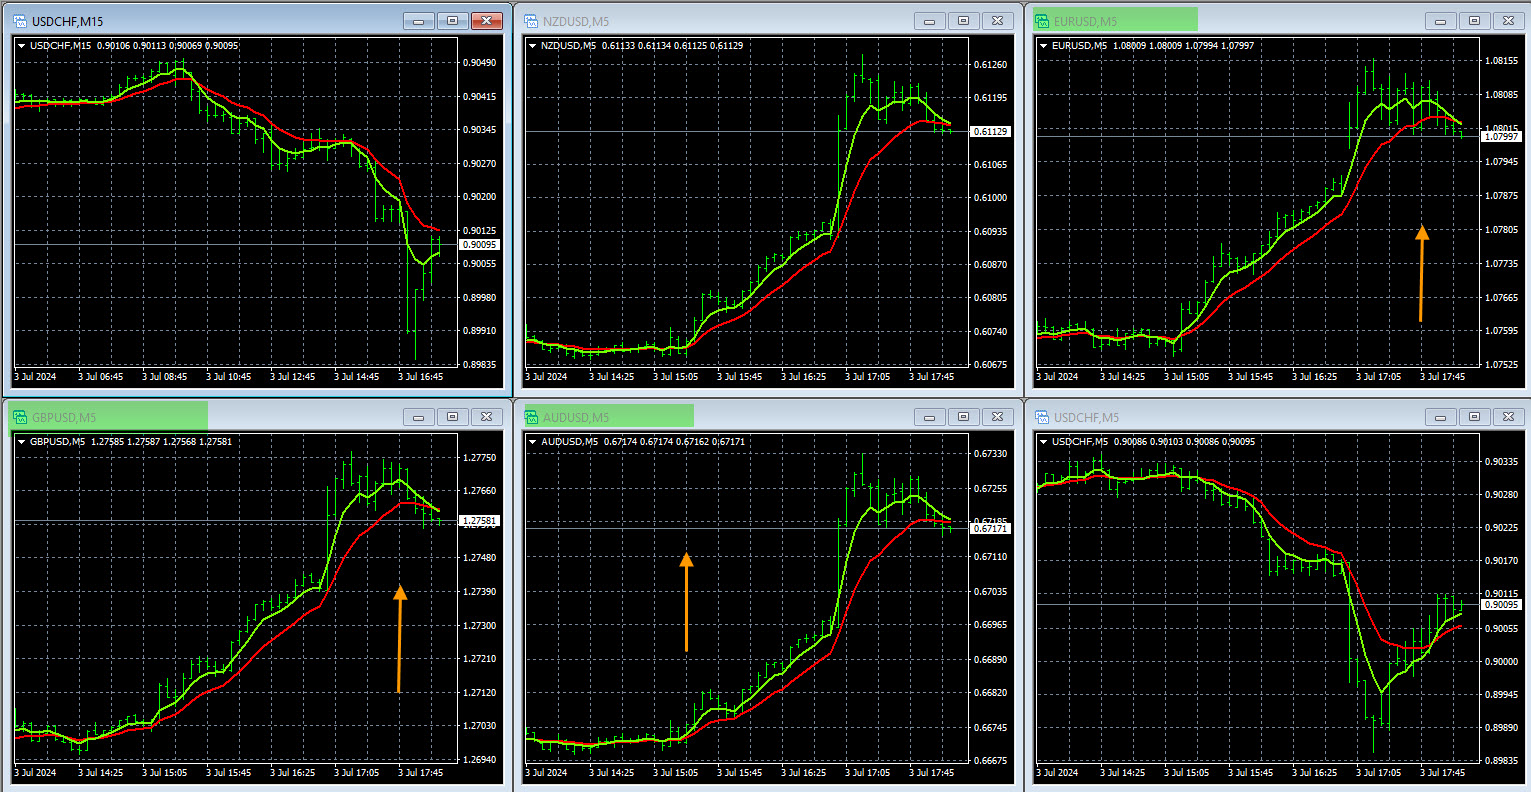
Look at the example USD pairs trades below with logical chart setup. On this trading day in the main forex trading session, the USD was weak on all pairs, causing considerable price movement. With the live heatmap indicator and consistent chart setuo with barcharts, you have eliminated the need for candlestick charts and at the same time created a much better trading system. Traders can set up their charts this way with proper correlated pairs for 28 forex pairs plus gold pairs.

USD Weakness Live Trading Signals

USD Weakness Live Trading Signals

Forex Candlesticks USD Pairs

Forex Candlesticks USD Pairs

Without the use of any forex candlesticks, you could have captured a great movements on the USD pairs in one trading session while trading with much higher confidence. The overall movement in all of the USD pairs was hundreds of pips. The live indicator you see for trade entries and momentum is The Forex Heatmap® forex heatmap , a live visual map of the forex market. This same trading system works for 8 currencies and 28 pairs. Compare this simple trading system with a stand-alone chart with a candlestick chart formation attached to one pair. In this regard forex candlesticks have no value to traders.

Conclusions about forex candlesticks: Forex candlesticks are in wide use by forex traders. But their effectiveness at making more than a few pips here and there is questionable by attaching them to one pair. In this article we give forex traders a clear simple, easy to set up alternative to candlesticks that will get the momentum of the market on their side across 8 currencies and 28 pairs, while bringing in many more pips into their forex trading. Forex candlestick charts are popular with traders but we have no idea why. Using candlestick charts because they are popular is the wrong reason.

How The Spread Is Calculated On Currency Pairs

In this article we will explain to forex traders how the spread is calculated on the most liquid and commonly traded currency pairs. This will give traders a better understanding of market structure and market participants. We will also explain why the bid/ask spread varies throughout the day.

What Is The Spread

The spread is the difference between the bid price and the ask price.

Forex Spreads

Forex Spreads

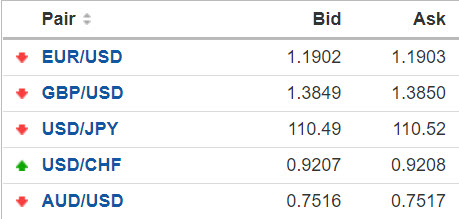
Look at the example above. You can see that the spread for the EUR/USD is 1 pip, but the spread for the USD/JPY is 3 pips. To calculate the spread, subtract the bid price from the ask price, the difference is the spread. For the USD/JPY 110.52 – 110.49 = 0.03 which is 3 pips. This is the transaction cost to the trader of executing the buy or sell trade when you buy or sell the USD/JPY with this particular broker.

In recent years the spreads have been tightening on the top 8 most liquid currencies. Traders should be able to trade the top 28 pairs comprised of these 8 currencies without any problem. Due to increased liquidity and trading volumes on most forex pairs, you will now see most spreads expressed with an extra significant digit, 5 not 4. The spreads will be shown in tenths or 1/10 of a pip.

Forex Spreads Tenths

Forex Spreads Tenths

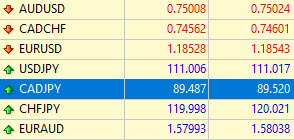
Look at the CAD/JPY bid and ask spread in the example above. The spread is expressed as 3.3 pips. 89.520 – 89.487.

Bid Price And Ask Price

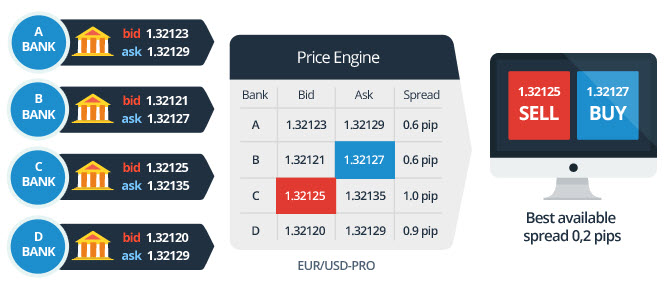
When a trader conducts a trade, they always buy at the ask and sell at the bid price, like at a live auction. The bid price is the highest price that all current market participants are willing to pay for a currency pair. The ask price is the lowest price rate at which the real time are willing to accept to sell the same currency pair. The difference is the spread, and in real time these are called “spot” prices.

How The Spread Is Created

How The Spread Is Created

In the example above the Bank A and Bank B, etc. might not be banks. They could be anybody, like a retail forex trader with a few mini lots, a broker or other dealer, a liquidity provider, or it could be a bank too. All market participants, small or large, are side by side. The highest bid and lowest offer is what creates the spread.

An ECN broker allows all market participants, big or small to find a counterparty for their buy or sell order and trading positions. Small retail investors are trading side by side with larger institutions. No conflict of interest. Bid and Ask quotes are created by the market, not the broker. All of the retail traders and liquidity providers are in the same electronic market side by side and the spread is created by the highest bid and the lowest offer from all participants. The role of the broker is strictly an intermediary between the individual trader and all other market participants.

With an ECN the spread will vary throughout the trading day. So retail traders remember this: a market order is not the bid or ask price you see, it is the next available price. The price you get may or may not be the same as what you see when you place your buy or sell order. Traders can use limit orders if they want to specify their prices.

Fixed Versus Variable Spread

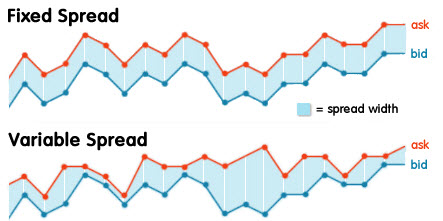
The type of spreads that you’ll see on a trading platform depends on the forex broker and how they make money. There are two types of spreads, fixed and variable or floating. Fixed spreads are usually offered by brokers that operate as a market maker or “dealing desk” model while variable spreads are offered by brokers operating a “non-dealing desk” model.

Fixed Spread - Variable Spread

Fixed Spread – Variable Spread

The choice between fixed and variable spreads depends on your trading style, risk tolerance, and market experience. It’s crucial to understand the characteristics of each type of spread.

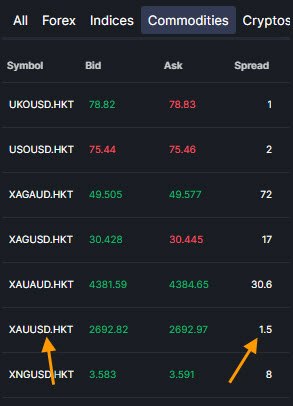
Example Gold Spreads

Example Gold Spreads

What Does The Spread Indicate

The spread on the spot forex market indicates two different things. The pair with the lowest spread is the EUR/USD. This is because the Euro and the US Dollar are the two most liquid currencies, so when combined they create a pair with the lowest spread. So the spread is an indicator of liquidity and trading volume. The lower the spread the higher the liquidity and popularity of that pair.

But spreads on the spot forex are not constant throughout the day. In the main trading session the spreads are always the lowest, and this is likely the best time to trade the forex market. Outside of the main trading session spreads will widen due to lower number of market participants. So spreads will vary based on time of day.

Forex Day Trading: System, Rules, Indicators, Alerts

In this article we will show traders an effective forex day trading system that is profitable. All indicators, rules and alert systems will be described, with example trades. We will also show traders how to improve on day trading results by focusing on the higher time frames across 28 currency pairs.

What Is Forex Day Trading

The classic definition of a day trade is to open and close a trade on one instrument on the same trading day. The forex market is a 24-hour day continuous market, so we would modify this definition to one trade open and closed in the same trading session or movement cycle. This is because the forex market has two trading sessions every day. The the main trading session and the Asian trading session, which are the best time to trade the forex market. You can day trade in either session.

An Effective Forex Day Trading System

One big mistake for forex traders to avoid is the use of technical indicators when day trading. Forex day traders need a reliable, momentum based system to get their pips faster, then exit the market in a shorter period of time. Each trade entry must maximize pip totals. The Forexearlywarning trading system is adaptable to day trading.

Indicator Set And Alert Systems

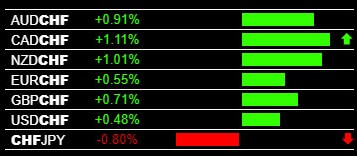
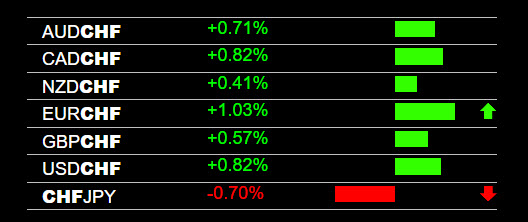
Now we will show traders what indicators to use, how to set them up, and how to be notified when day trades are happening, in real time, across 28 currency pairs. Look at the indicator below, The Forex Heatmap® forex heatmap. This indicator gives live trading signals for 8 currencies and 28 pairs. The example you see is for the CHF pairs. The CHF is weak on all pairs against the major currencies. This is a clear sell signal for the CHF/JPY.  Also, the CAD/CHF moved up strong.

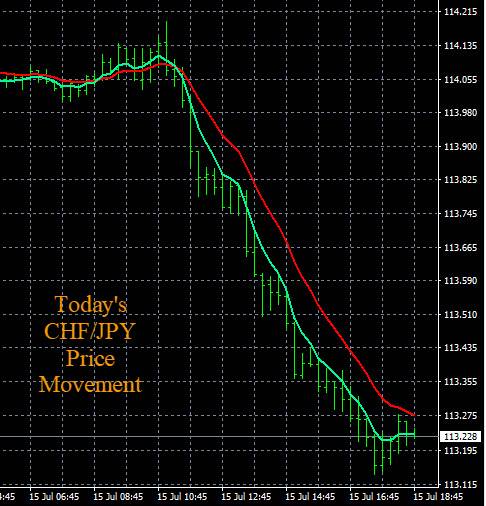
The CHF/JPY dropped about 80 pips on this trading day. A forex day trade could have netted about 40 pips of that fairly easily. Getting 40 pips on a day trade is more than most forex day traders make in a week scalping the same pairs over and over. This is one intraday movement cycle and the combined pips of all CHF pairs on this day was in the hundreds of pips. So clearly, day trading 28 pairs is possible with this trading system.

Forex Day Trading

Forex Day Trading

Part of your indicator set for forex day trading would be a good set of trend indicators. Forexearlywarning provides all traders with a set of free forex trend indicators. Look at the image below to see how they look on the intraday time frames.

Forex Day Trading Chart

Forex Day Trading Chart

Our mobile app is shown below. The Forexearlywarning mobile app scans the market across 8 currencies looking for valid entry and day trading signals. When our forex mobile app algorithm sees consistent signals, it notifies the trader/end user via push alert on their cell phone or mobile device.

Forex Day Trading Alerts

Forex Day Trading Alerts

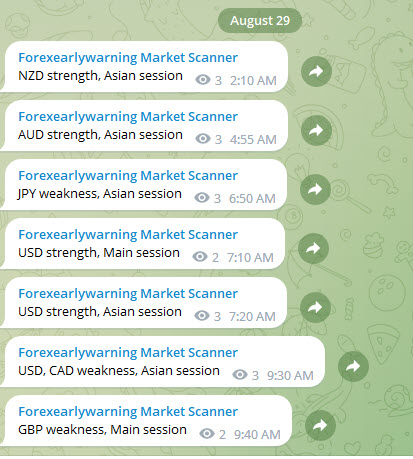
The CHF weakness push alerts go to your phone, then you can check the trends and heatmap signals to see if a forex day trade is possible. We also have several other professional forex alert systems that notify day traders when the market is moving.

A Simple Set Of Rules For Forex Day Trading

So now we can write down a set of forex day trading entry rules. The trader would set up the proper alert systems, like our mobile app. Then, when the alerts hit, mostly in the main trading session or after forex news, we would check the heatmap signals and support and resistance levels to see if a day trade is possible. The day trader would focus on the smaller intraday time frames like the M5, M15 and M30 time frames for day trading, an example chart is above.

Money management rules for day trading are fairly simple. If the trade stalls or goes nowhere within the first 30 minutes in the trade we would exit with a small gain or loss. If the trade proceeds into positive pips, the trader would exit with a profit or when the prifit target is reached. Day traders should always trade with a stop order.

Day Trading The EUR/USD 

The most popular pair to day trade is the EUR/USD. Forex traders focus on this pair due to the liquidity and low spread. This pair is also popular with scalpers.

There are four possible scenarios for successfully day trading the EUR/USD. For buying the EUR/USD, the EUR must be consistently strong or the US Dollar must be consistently weak. For selling, the EUR must be consistently weak, or the USD must be consistently strong. An even better scenario is when one currency is strong and the other one is weak, in this case the movements will be very strong.

Day Trading EUR/USD

Day Trading EUR/USD


EUR Pairs Chart Setup

EUR Pairs Chart Setup

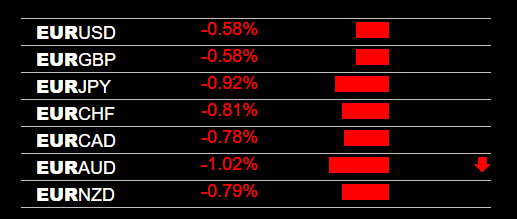
In the example above, the EUR is consistently strong weak the seven other major currencies, so this should be a great live signal for day trading and selling the EUR/USD. When the EUR is consistently strong you can get movement cycles that are much stronger than traders can get with technical indicators. If the EUR/USD is quoted at 1.2020, a 1% movement is about 120 pips, and your EUR/USD day trades are safer and much more productive as far as potential pips. The Forex Heatmap® is a very strong tool for EUR/USD day traders to use. In this example the EUR/AUD was also an excellent choice for day trading as the AUD was slightly strong. 

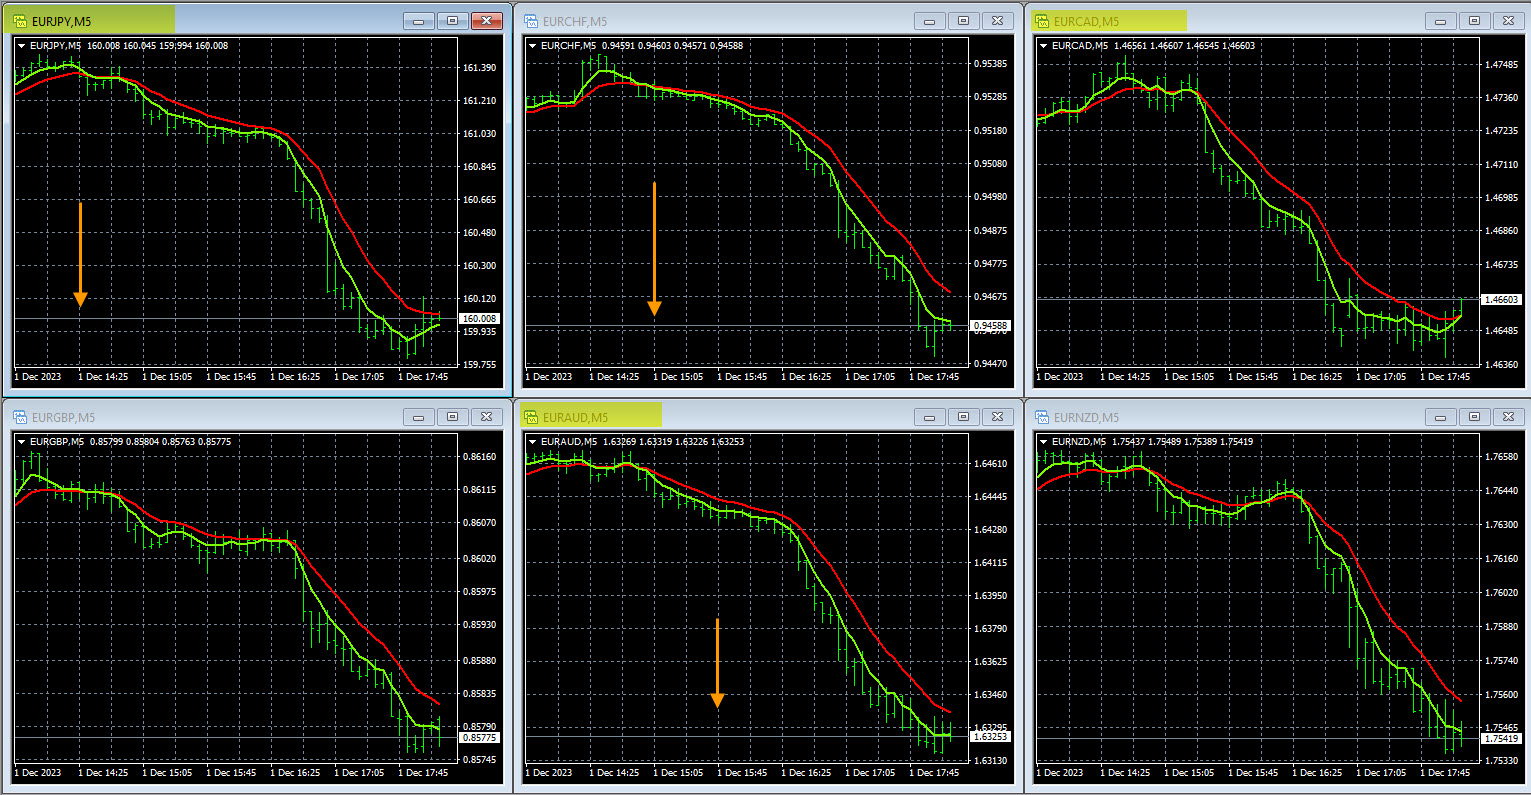
The chart setup is consistent with our live indicator and should be set up this way for 8 currencies and gold using the metatrader profiles.

Excellent Alternative To Forex Day Trading

If the forex market is ranging on the smaller time frames, in ranges of under 100 pips, we believe forex day trading is a viable method of trading. But if the forex market is trending across many pairs on the larger time frames, or ranging in wide ranges, we believe there is a better way to trade the forex market than day trading.

In a trending or wide ranging market we urge traders to utilize all 28 pairs composed of the 8 major currencies for increasing the number of trading opportunities, instead of getting stuck forcing trades into the EUR/USD. Always go with strongest movers, momentum and best trading signals. If the market is trending you can make more pips for almost no extra effort.

Look at the trade example above on the CHF/JPY. In a tight ranging market of less than 100 pips, we would likely advise exiting the trade as a short term day trade. However, if the CHF/JPY is in a strong downtrend on the D1 time frame, or ranging in a 250 pip range, we would advise scaling out lots and holding on to some lots. The CHF/JPY can then continue lower in the trend or range to the next major support area. The trader can continue to profit from the remaining lots with almost no additional effort, keeping the breakeven stop in place.
Forex day traders need to be aware of the other forex trading styles. When the market conditions change from tight ranging or choppy, they might be able to start swing trading on the H4 time frame or trend trading on the D1 or W1 time frames. When trading in the direction of the larger time frames, one trade entry point can make them pips today and also tomorrow, with no additional effort.

Here is our video overview of forex day trading on Youtube.

Conclusions about forex day trading: If you would like to day trade the forex market, you can do so with the indicator and alert systems provided by Forexearlywarning. But we will suggest that if you enter a trade in the direction of the major trends, that you make a good effort to stay in the trade as long as possible and let the trend do the work at getting you more pips.

Forex Risk Reward Ratio: How To Minimize On Trade Entries

In this article we will examine risk to reward ratio for forex trade entries. We will show traders how to greatly reduce and minimize risk, and possibly even eliminate risk on their forex trades with some strong and steady rules for entries. Forex traders need to increase their expectations for making pips, while lowering their risk to reward ratio, trade after trade.

How to Calculate Risk Reward Ratio

Risk to reward ratio is the inverse of number of pips you expect to make on a trade divided by the number of pips at risk. Example: If you enter a buy trade on the GBP/USD at 1.3780 and set a stop order at 1.3750 you have 30 pips at risk. If you expect the GBP/USD to go up to 1.3900, you expect to make 120 pips. 120/30 equals 4, this is your risk to reward ratio for this trade.  You expect to make 4 pips for each one you risk in this example.

What Is A Good Risk Reward Ratio

If you look around the internet and on many forex websites, they continue to spread bad information that a good risk to reward ratio for a forex trade is about 1.5 and 2.0. We believe that this is way too low and should not be used. Forex traders should never settle for less than 3.0 or 4.0 to 1, and also we see many trades that are 10 and 20 to 1 and even higher. It is clear that forex traders need to re-think their risk to reward approach to trading.

Scalping the EUR/USD with technical analysis indicators on the smaller time frames is the reason that forex traders accept such a low reward for the risk they take, and if you continue reading this article you will see why. If forex traders moved away from the technical indicators to momentum and trend based trading system, that takes into account price targets, they would have much higher rewards using the techniques and tools that we provide.

Is Negative Risk Reward Ratio Possible

Yes and some forex traders trade this way! If you are scalping the EUR/USD on the smaller time frames you might be trading with a negative risk to reward ratio. If your goal is to make 10 pips with a 30 pip stop order or no stop order at all you are upside down. Technical indicators are ineffective and this is what most traders do. Also, scalping without a stop order has unlimited risk, and this practice is very bad. But this is what forex traders are doing with their trading accounts. Keep reading this article for some good strategies and solutions to this.

Three Proven Ways to Lower Risk and Improve Reward

Traders are ready for some proven forex risk reward strategy ideas to incorporate into their trading. We will now present three strategy ideas. 1)trading entry points with strong momentum in one direction, 2) using the larger time frames, and 3) the 30 minute rule for trade management or exits. Combine all three of these risk reward strategies and you have maximized pip potential for all of your trades.

Risk Reward Strategy 1 – Strong Momentum On Entry

One way to reduce risk and increase potential reward on all of your forex trades is to use strong and consistent momentum across at least one currency at the entry point. Look at the example below.

Forex Risk Reward Ratio

Forex Risk Reward Ratio

Forex Risk Reward Ratio Chart

Forex Risk Reward Ratio Chart

Using this live signal system, The Forex Heatmap® forex heatmap, a traders could execute a sell on the GBP/CHF and make pips with confidence. When the pair starts to stall at intraday support they could scale out lots and move their stops to breakeven. Then, if this pair is trending down on the higher time frames, they could retain some of the sold lots in their accounts for further profit in the direction of the trend.
Using a sell point of 1.2950, this pair dropped as much as 300 pips in one trading session. Using an initial stop of 30 pips, this translates to a 10 to 1 or 0.10 risk to reward ratio, which is much higher than forex traders are used to. If this pair is trending down on the larger time frames like the D1 or W1 time frame, many more pips are possible. Plus, by scaling out lots, you increase your account equity and the stop order on the remaining lots is at breakeven. So you have zero risk on the remaining lots.

Using strong and consistent momentum across at least one currency in the pair is a proven method of reducing entry risk while preserving high reward on trade after trade. This same technique works on 8 currencies and 28 pairs total.

Risk Reward Strategy 2 – Use the Higher Time Frames

Another proven way to reduce risk and increase potential reward on all of your forex trades is to use the higher time frames and trends. Look at the example below:

Forex Risk Reward Strategy

Forex Risk Reward Strategy

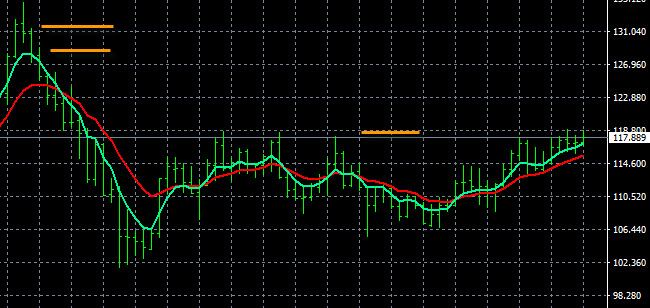
This is the CHF/JPY on the MN time frame. If you enter a buy on a price breakout of 118.80 resistance area, this pair has a chance to move up to the 129.00 to 131.00 resistance area. This is upside potential of 1000-1200 pips. Assuming an initial stop order of 30 pips, the risk reward ratio would be between 33 and 40. This is outstanding risk reward ratio.

Traders can monitor this pair with price alerts or any one of our professional forex alert systems, then use The Forex Heatmap® to manage the trade entry to a break even stop. Using the higher time frames, like the H4 and larger, will result in much higher potential rewards, trade after trade.

Risk Reward Strategy 3 – 30 Minute Rule For All Trade Entries

Another way to reduce risk is by using the 30 minute rule on all forex trade entries. Here is the rule: If you enter a forex trade, if you are not profitable enough to move your stop to breakeven and scale out lots after 30 minutes to one hour, then go ahead and exit. If you follow Strategy 1 above this should not be an issue. Your trade entry must be solid and profitable or you must exit after about 30 minutes to one hour. If you have a successful entry, scale out lots and move your stop order to breakeven. This reduces your risk to zero, plus by scaling out lots you have increased your reward by increasing your account balance. Using strong momentum on your trade entries is the key (Strategy 1). Great tools like The Forex Heatmap® will prove invaluable to setting and moving stops to breakeven and reducing the risk on many of your trades to zero.

Combine All 3 Strategies on Every Trade Entry

If you combine all three of these strategies on all of your trade entries you have created a powerful risk to reward management system for all of your trades, with little or no room for improvement.

Other Risk Reward Ratio Strategies

It should go without saying, but all forex trade entries should be accompanied by a stop order to prevent large losses. Then, by moving the stop to breakeven you eliminate all risk. Trading in the direction of the major trends of the forex market will increase the reward sie of the ratio. If you enter a trade into a trending pair, you can move your stop to breakeven and let the trend do the work from there. Larger time frame trends always will have the most pips. If you can enter a trade at the beginning of a trend cycle, that lowers your risk and increases your potential reward at the same time. Avoid standing orders, also called buy stops and sell stops, they have too much risk. With great tools like The Forex Heatmap® they are not necessary. Go with market orders that have strong momentum on entry.

As far as position sizing, all trades don’t have the exact same characteristics. If you do some level of demo trading you will see this more clearly. If you are comfortable trading 6 minilots on all of your trades, but you sense that you might have a risky trade entry in front of you, you have a choice of not trading at all or trading less lots, like 2 minilots for example. This reduces your risk on a percieved riskier trade. When you see a clear trade entry with all of your rules for trade entries fully met, you can trade the full 6 minilots you are accustomed to.

Conclusions about forex risk reward ratio: Currently, forex traders accept risk reward ratios that are much too low. Trying to make 2 pips for each pip you risk is simply not worth it. Too much risk, not enough reward. Using the tools and techniques we have shown you in this article, traders should be looking for risk reward ratios in the range of at least 3-4 on the intraday movements, and up to 20-30 on pairs that are trending on the higher time frames.

What Makes Currency Pairs Move, A Guide For Traders

If a forex trader knows what makes currency pairs move, then they can start to cash in on the movement cycles in the highly liquid spot forex market. In this article we will show traders all of the reasons that cause movement of currency pairs. Without movement, currency traders cannot profit.

Currency Fundamentals Makes Pairs Move

Over the long term cycles and trends, the interest rates or direction of interest rates will cause currency pairs to develop long term trends and move in one direction. The pairs with the biggest interest rate differentials between the two currencies would be the best choice for buying or selling. Currency interest rates for both currencies in any pair would be great information to have.

For example if you wanted to buy the USD/JPY pars, you would want to know the USD interest rates as well as the currency interest rates for the JPY. Since most traders focus on the eight most liquid currencies we would advise knowing the current interest rates and also the direction of interest rates for these currencies. Central banks publish this data. Forex fundamental analysis and knowledge of world interest rates trading is one approach to finding currency pairs that move.

Currency Strength Causes Movement

Over the short term having one currency strong and one weak in the same pair will cause the most movement in real time, or over the course of a few days. This is called currency strength trading, and we have more than one currency strength indicator in our trading system. In the short term what causes a currency pair to move? Currency pairs move for one simple reason. One currency is strong and the other currency in the pair is neutral or weak. Here are some examples:

The EURUSD is a popular pair for spot forex traders, so let’s use this pair for an example pair to illustrate this concept.

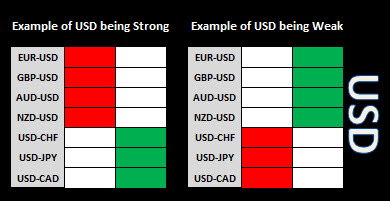
If the EUR is strong and the USD is neutral or weak, the EUR/USD movement will be much stronger, and traders can take advantage of this.

If the EUR is weak, and the USD is neutral or strong, the EUR/USD average daily movement will be strong and this pair will move down, and traders can also take advantage of this.

The average pip movement per currency pair is not nearly as important as knowing if one currency is strong or weak on the same pair. Traders can use these simple concepts to make pips every day, because this is what causes currency pairs to move. These simple concepts work for any pair. Since most traders only trade a few pairs, this opens up a lot of opportunities to make move pips by choosing a pair to trade that fits these basic conditions across the most popular 28 different pairs.

See below a real time forex indicators called The Forex Heatmap® that uses currency strength to tell traders what is the best pair to trade with consistent strength in one direction. It works for 28 pairs.

What Makes Currency Pairs Move

What Makes Currency Pairs Move

The average daily pip movement forex is somewhat meaningless. What matters is that if one currency is consistently strong and one currency is consistently weak on the same pair. In this case you will always have big movement cycles and have a chance to capture those movements. The fluctuation of two currencies against each other in the same pair is what you need to know, not the average daily pip movement.

The Forexearlywarning trading system uses these currency strength concepts across 28 pairs, and almost all of them have good liquidity and low spreads in the main trading session, so all of these pairs are great candidates for trading.

Some traders say that supply and demand will ultimately impact the price movement. We know this has to be true but the currency supply and demand on the two currencies in a pair will ultimately be reflected in the prices, which is measured by the heatmap in real time. Trend tools like moving averages are price based, so ultimately whatever factors affecting demand and supply of currency will eventually show up in the short term movements and long term trends in the market. Trend indicators are discussed below.

Capturing Strong Currency Pair Movements

As a trader your objective it to capture strong movements on currency pairs when they occur. This means that you must have some professional forex alert systems at your disposal to notify you of when the market starts moving. This would include Metatrader 4 alarm systems, audible price alerts, forex news calendar, and currency strength alert systems available to you. You can learn more about these professional forex alert systems in this article.

Market Trends are Also Important

Traders can also use market trends to help them determine why certain currency pairs are moving. Using forex market trends will help to determine what pairs will move, especially trends on the larger time frames.

Here is a forex trend strategy you can use: If all of the JPY pairs are moving up on the D1 time frame trend, this means that the JPY is weak. By having the USD/JPY, CAD/JPY, GBP/JPY, etc. on one screen traders can make much better decisions when they enter trades based on the trends of the market. This same forex trend technique applies to any group of pairs with one common currency. Learn more about this forex trend technique in this article about multiple time frame analysis by individual currency.

Forex News Can Cause Price Movement

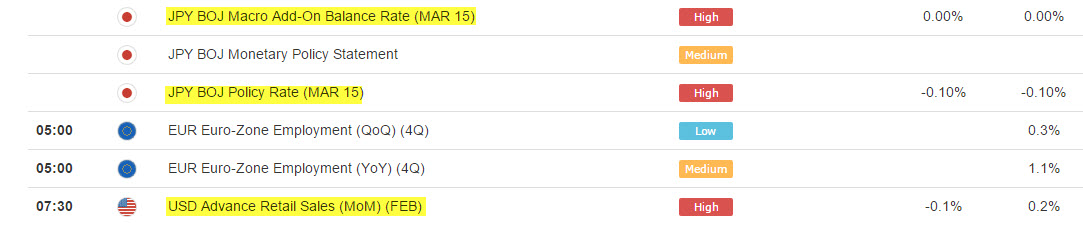
Forex news drivers and scheduled news can cause a lot of price movement on currency pairs. If any of the eight major currencies have a scheduled news driver or unexpected news, the currency markets can move fast, depending on the outcome of the news. There are no EUR/USD news or USD/JPY news per se. Just news drivers for the individual currencies that comprise the pair. Traders should learn all they can about how forex news can impact movement. Traders can see the exact times of potential currency movement on the forex news calendar. See the JPY news items in red below on the calendar.

What Makes Currency Pairs Move

Forex News Calendar

Forex Technical Indicators Are Ineffective

Almost all forex traders scalp with technical indicators like RSI, Bollinger bands, Aroon, Divergence, etc. But these technical indicators are massive failure for traders and a waste of time. Will technical indicators help a trader to determine the cause of why a currency pairs move? No they will not, technical indicators are just drawings on a piece of paper or computer screen, they will not tell you why a currency pair moves. They are completely flawed. We recommend not not using forex technical analysis and indicators as part of any good forex trading system, they simply do not work.

Some Currency Pairs Move Faster Than Others

Some currency pairs are more naturally volatile than others. Of the top 28 currency pairs, a 1% movement can be much more or less than another pair. For some pairs 1% movement can be 250 pips, and other pairs a 1% movement can be 75 pips. To learn more about the 1% rule we have a great article about currency pair characteristics where you can estimate forex volatility for any pair. This is not a tool like a forex volatility calculator, but a technique that allow you to quickly estimate the volatility of the pair you are trading.

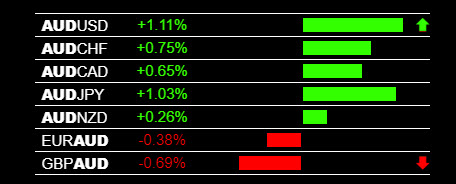
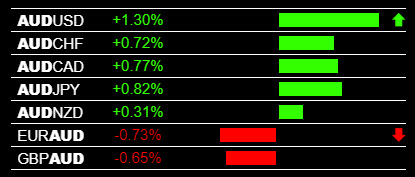
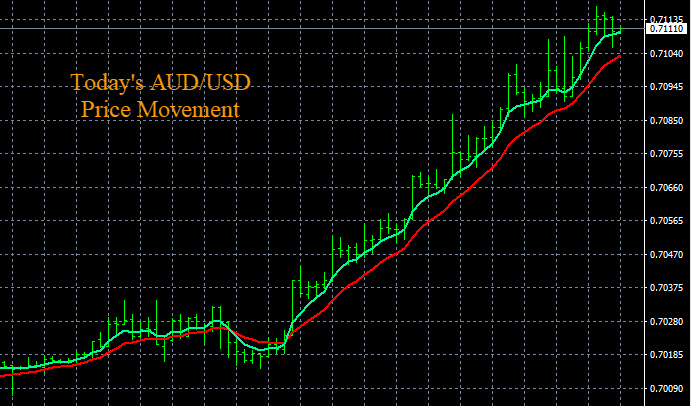
A low volatility currency pair can become much more volatile if one currency is consistently strong and one pair is consistently weak, we refer to this as a “slingshot”. The example below shows an 80 pip movement for the AUD/USD pair just because the AUD was strong and the USD was slightly weak. If you have a more volatile pair with one currency consistently strong and the other consistently weak, these pairs can move 250-300 pips in one trading session. This type of movement is somewhat regular using The Forex Heatmap®  currency strength signal system.

What Makes Currency Pairs Move

Fast Moving Currency Pair

What Makes Currency Pairs Move

Fast Moving Currency Pairs

When Is The Best Time Of Day For Lots Of Currency Pair Movement

The forex market is 24 hour market. But the best time to trade forex market is a much narrower window of time called the main trading session. It is about 5 hours every Monday through Friday. Learn more about the forex trading session and the best time to trade the forex market, and spend less time in front of the computer and still have the best chance to make pips, every day.

Conclusions about what makes currency pairs move:

We know that fundamentals like interest rates, currency strength, economic news, unexpected news, supply and demand, and natural high volatility of certain currency pairs causes a lot of movement. As traders we must have accurate alert systems, signals, and knowledge of the market conditions like trending or ranging to cash in and make consistent pips from these movements.

We advise avoiding technical indicators and trading on the smaller time frames. Examine individual currencies daily and trade in the direction of the major trends for better price movement and more net pips into your trading account.

How to Trade Forex Price Breakouts

The first step in trading forex breakouts is to identify current behavior of the pair you are interested in trading. We would look for a pair that is moving sideways and consolidating, or consolidating after a movement in the direction of a major trend on the H4, D1, or W1 time frame. We have two breakout examples to present here.

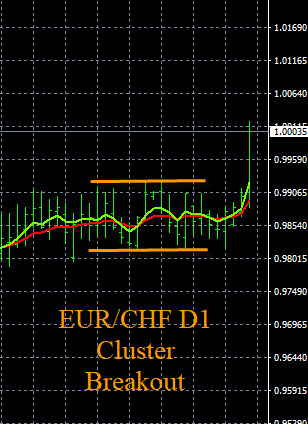
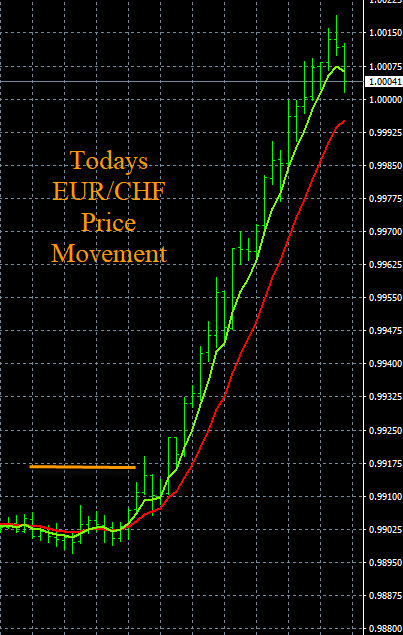
Next, traders should identify the breakout points. Either a resistance or support breakout point, or both in some cases. Look at the pair below in the image. This is the EUR/CHF pair, it is moving completely sideways on the D1 time frame trend, so it is a candidate for a price breakout in either direction. Sometime pairs move sideways like this for 10-15 days because the forex market lacks volatility, or both currencies (EUR and CHF) are both strong or weak at the same time. Either way it is an opportunity to catch the next breakout and formation of a new trend.

Forex Price Breakout

Forex Price Breakout

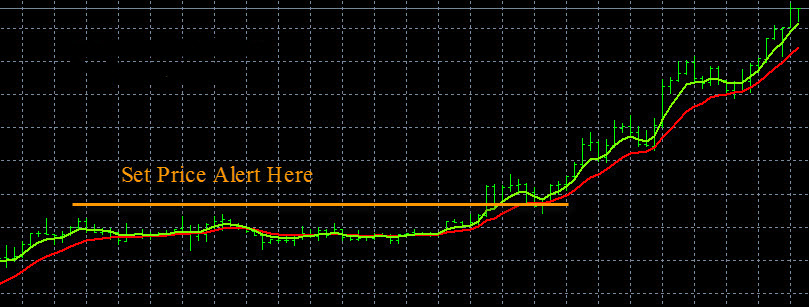
When a pair is moving sideways like this traders can set audible price alerts to intercept the next breakout and movement. In this case you can set two price alerts to intercept the movement in either direction. Setting two price alerts on either side of the sideways channel consolidation is called a straddle alert. See the yellow lines for the location of the price breakout alerts.

What To Do When The Breakout Alerts Hit

When the price breakout alerts hit, you need to verify your trade entry. With this trading system , you can check the live signals on The Forex Heatmap®. In this case the live signals indicated that the CHF weakness was consistent across many pairs and was driving the movement that caused the breakout to occur.

Forex Price Breakout Signals

Forex Price Breakout Signals

Forex Price Breakout Chart

Forex Price Breakout Chart

On the smaller time frames like the M15 timeframe shown above you can see the intraday movement cycle more clearly, just over 100 pips. After the pair makes its intraday breakout movement, then you must re-assess the related market pairs on the higher time frames to see if you should continue to hold the trade. Traders must re-assess larger time frames and price targets after the EUR/CHF pair starts to consolidate and or retrace. You can scale out lots or exit as daytrade. If the EUR is strong or the CHF is weak on at least the H4 time frame, the best course of action is to scale out some of your lots, then also hold some lots in case the pair continues higher in the newly established h4 or D1 uptrend to the next resistance target.

Along with audible price alerts, Forexearlywarning also has a complete suite of professional forex alert systems, including push alerts to your cell phone. We can provide forex traders with various ways to monitor the market for price movement and breakouts across the top 28 most liquid pairs.

What Is The Best Time To Trade Forex Breakouts?

The best time to trade forex breakouts is in the main forex trading session. You can also trade breakouts in the Asian trading session on the AUD, NZD and JPY pairs after significant news drivers that can be tracked on the forex news calendar. Breakouts on 28 pairs and all 8 of the major currencies can be traded in the main trading session. This includes all combinations of the USD, CAD,  EUR, CHF, GBP, AUD, JPY and NZD pairs.

Trending Pairs Also Have Price Breakouts

If a currency pair is trending up or down on the H4 time frame or larger, you can set a breakout alert to intercept trend continuation movements and directional trades. Look at the example below:

Forex Price Breakout Alerts

Forex Price Breakout Alerts

This pair is trending up on the D1 time frame. It starts to consolidate and form a bull flag chart pattern. Traders should go to the shorter time frames like the M15 time frame pictured above and set a price breakout alert on this pair. Once again, when the price alert hits, go check the signals on The Forex Heatmap TM and look for consistent strength on the base currency or consistent weakness on the cross currency, or both. This will create momentum and a strong entry point.

Conclusions About Forex Breakouts – In this article we outline effective ways to intercept and profit from two kinds of forex breakouts on trending and non trending pairs. Put these procedure into practice to improve your forex trading and pip totals.

the5ers, FTMO: Best Trading Strategy To Get Funding

Forex traders who are considering getting a funded forex trading account from the5ers, FTMO, or any other top level forex funding provider, will need a trading system or strategy to qualify for the funds. In this article we will show traders a low drawdown trading strategy which will help them qualify for a funded forex account. This low drawdown trading system will work well with with the top forex account funding providers.

the5ers, FTMO Do Not Provide A Trading Strategy

the5ers and FTMO, along with the other funding providers provide live capital and funding to forex traders. Traders who have good trading skills, but are short of money to fund their own live account can use these two firms for capital. These capital and funding providers a very valuable service for forex and gold traders, however they leave the trading style or trading system entirely up to the trader.

Most forex traders are familiar with things like fundamental forex trading, news trading, and the use of technical analysis indicators. We are proposing that traders seeking funding use a much better trading system, with low drawdown, to match the funding providers drawdown parameters listed in their funding programs. This is a trend based trend based trading system with much more accurate, low drawdown trade entries. Forex funding providers like the5ers and FTMO all have drawdown limits, so a low drawdown trading system will work well at getting traders a funded forex and gold trading account.

All forex and gold trading funding providers have different leverages, payout percentages % and drawdown limits on funded accounts. When attempting to qualify for funding or trading a funded account, the funding providers have written daily and weekly drawdown rules that must be met to get account funding. The drawdown percentages vary widely, between 1% and 10%. So accurate trade entries are necessary to meet the funding providers drawdown rules.

What Is The Best Trading Strategy to Get Forex Funding?

If you are looking for a trading system, trading strategy or style to help you get third party funding for your trading account, we can offer you a great option with the Forexearlywarning trading system. Traders need to seek out and identify a profitable strategy before they seek funding, then demo trade their strategy and system. Forex traders who are interested in a trend based based trading system and trade entry confirmation will like Forexearlywarning.

The Forexearlywarning trading system is a trend based trading system. The system uses some simple trend indicators applied across multiple time frames, and we also use support and resistance levels for price breakouts and targets. We use real time indicators to assist with trade entries.

The system and strategy we use is for daytrading, or trade entries into the trend for swing trading on the H4 time frame. Our entry tool will provide trade entries into the higher time frame trends also, like the D1 or W1 trends, for longer term positions. Trade entry points with this trading system can be very low or nearly no drawdown. We have a specific set guidelines for trade entry points and timing.

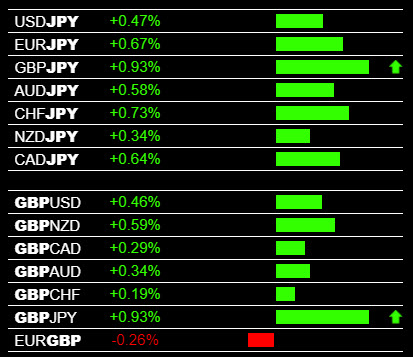
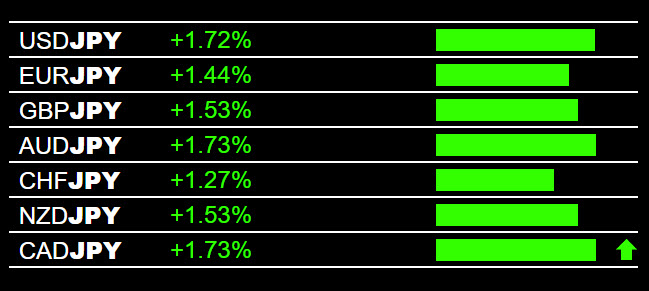
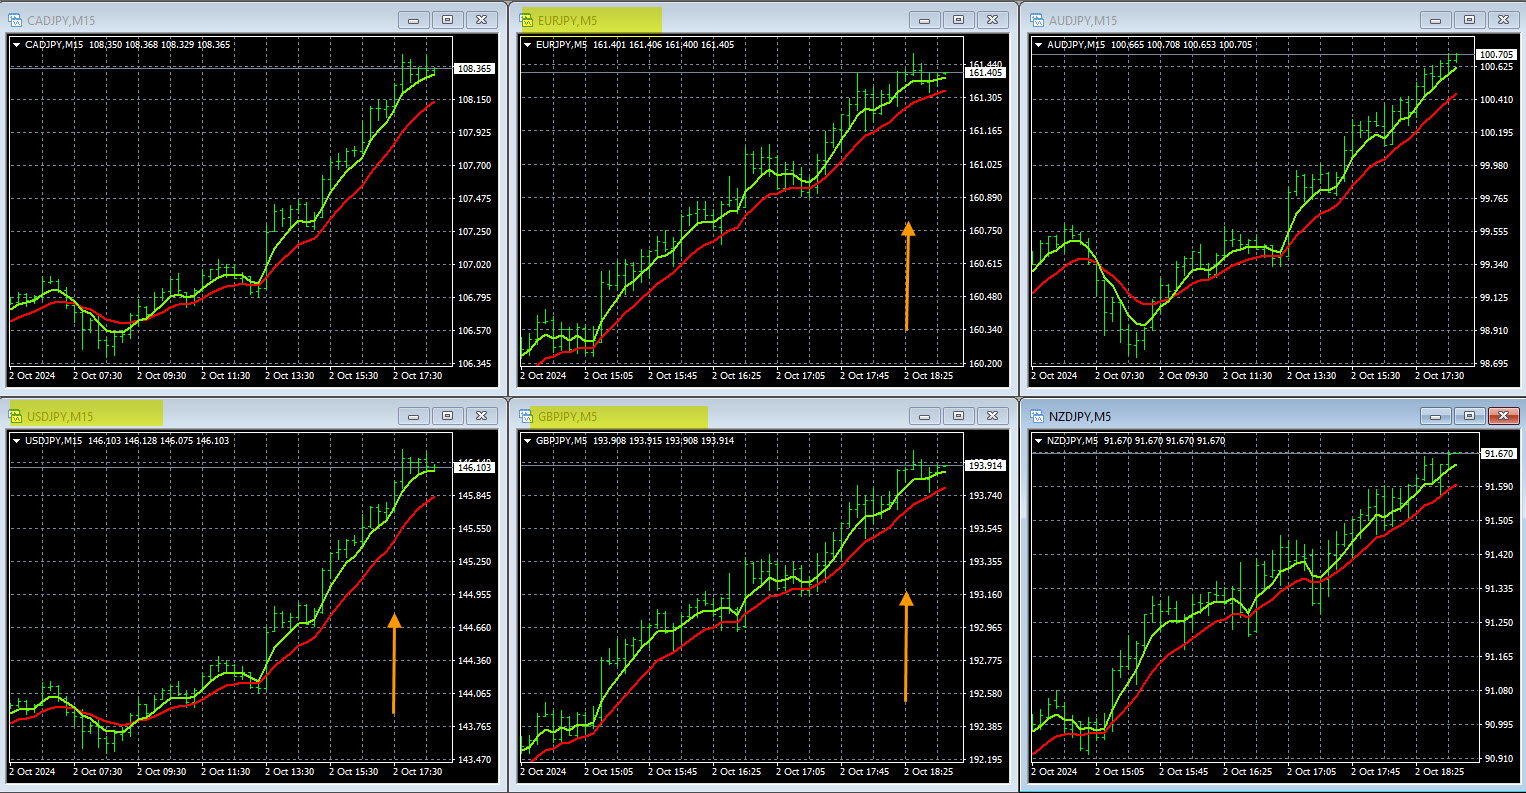
Here is an example trade entry for the GBP/JPY or CAD/JPY. As you can see the JPY was consistently weak against the most liquid currencies on this trading day. Our live signal system, The Forex Heatmap® forex heatmap , pointed traders to buys on these two pairs. The movements on all of the JPY pairs were strong across the board. In one trading session, hundreds of pips were possible, with little to no drawdown.

This is what forex traders need to qualify for a funded forex trading account. They need clear, real time signaling systems and strong movement cycles. This trading system and indicators works the same way for the 8 most commonly traded currencies, and 28 pairs total. Forex traders trade popular pairs like the EUR/USD and GBP/USD. But now traders can open up their trading to many more pairs as well as gold and increase their pip totals.

The 5ers FTMO Trading Strategy

The 5ers FTMO Trading Strategy

The 5ers FTMO JPY Charts

The 5ers FTMO JPY Charts

We also provide traders with the trend indicators you see in the JPY pairs image above  image. Traders can use these exponential moving averages to group pairs by individual currency, like grouping all of the JPY pairs together on one screen. This single currency analysis will help all traders find more high probability, low drawdown trades. We can also show traders many more forex trade entry examples for 28 pairs, including popular pairs like the EUR/USD and GBP/USD.

If you are a forex trader who is making comparisons between FTMO versus the5ers, or other funding providers, remember that whatever forex funding provider you decide to use, you will still need to have a great forex trading system. We believe the Forexearlywarning trading system offers the best trading system and strategies for daytrading and swing trading the forex market. Check out our great article about how to get a funded forex account with more details about the the5ers, FTMO funding programs. This article has details on how to find top level funders.

Conclusions About the5ers, FTMO trader funding programs:

We believe these forex funding providers are providing a valuable service to forex traders to give traders access to funded forex trading accounts. But none of these funding providers provide traders with a high quality, low drawdown trading system.  Forex traders need to trade accurately to qualify for a funded forex account. We believe the Forexearlywarning trading system is way ahead of most or all of the other trading systems we have seen at providing low drawdown trade entries and consistent, positive trades. The Forexearlywarning trading system should be part of any trader’s attempts to qualify for 3rd party forex funding.

New Zealand Dollar NZD Pairs Are Overlooked By Most Traders

There are 7 New Zealand Dollar NZD pairs that can be easily traded by forex traders. Forex traders continue to overlook NZD trading and these pairs, but they present great opportunities to make pips. These pairs include the NZD/USD, NZD/JPY, NZDCAD, NZD/CHF, EUR/NZD, GBP/NZD and AUD/NZD. Seven NZD pairs total.

New Zealand Dollar NZD Pairs Characteristics

The most popular pair that forex traders trade is the EUR/USD. Many of the New Zealand Dollar NZD pairs have characteristics that are are much better for trading than the EUR/USD. We trade 28 pairs total in the Forexearlywarning trading system, including all seven NZD pairs.

The NZD pairs offer a wide variety of characteristics, like low volatility to high volatility, and can be traded in the Asian trading session or the main trading session. From the standpoint of market trading hours, any trader in the world can trade these pairs throughout the trading week.

New Zealand Dollar NZD Pairs Volatility

New Zealand Dollar NZD Pairs Volatility

The volatility characteristics of the New Zealand dollar pairs can be a great benefit to traders. Take the EUR/NZD for example. When this pair is moving in the main trading session the volatility is beneficial as this pair moves much faster than more popular pairs like the EUR/USD. This allows traders to take profits and move stops to breakeven faster. And the GBP/NZD is suitable for traders who have experience trading volatile instruments, volatile stocks or low float stocks with high volatility. Traders who are looking for volatility will love trading the GBP/NZD.

The spreads on the NZD pairs are reasonable from most forex brokers for all of the NZD pairs during the main trading session. However on some pairs like the AUD/NZD or GBP/NZD you may have to check with more than one broker as spreads on these pairs are higher. Being aware of the most of the currency pair characteristics of the pairs you are trading will open the door to many more pairs and more pip potential.

When To Trade The New Zealand Dollar NZD Pairs

The New Zealand Dollar NZD pairs can be traded during the best times to trade the forex market, during both sessions. The Asian trading session and the main forex trading session. You can check the forex news calendar and you will see that the NZD news drivers occur frequently in the Asian trading session and drive movement on these pairs. All currencies can move in the main trading session. This is an advantage over trading the EUR/USD, which only moves on the main session. Surprising but true as most traders continue to focus on just one pair.

New Zealand Dollar NZD Economic News

New Zealand Dollar NZD Economic News

How To Set Up Trend Indicators for Monitoring the New Zealand Dollar NZD Pairs

Lets look at the best way to set up your trend indicators for trading the New Zealand Dollar NZD pairs. Traders can start with our free forex trend indicators, which is a system of exponential moving averages for tracking individual currencies.

New Zealand Dollar NZD Pairs Trend Indicators

New Zealand Dollar NZD Pairs Trend Indicators

New Zealand Dollar NZD Pairs Grouped Together

New Zealand Dollar NZD Pairs Grouped Together

The next thing you would like to do is set up all 7 New Zealand Dollar NZD pairs together in a group, side by side. This makes it much easier for traders to see if the NZD is consistently weak or strong. For example if all of the pairs with the NZD as the base currency NZD/ are trending up, and all of the pairs with the NZD as the cross currency /NZD are trending down. The NZD is strong and you should be trading in that direction. This is called forex analysis using parallel and inverse pairs, and is by far the best analytical method available to forex traders.

Grouping the New Zealand Dollar NZD pairs together allows trader to see if a valid trade is possible and to check if the NZD is consistently strong or weak.

How To Enter Trades on the New Zealand Dollar NZD Pairs

Now we will present some rules for entering trades on the New Zealand Dollar NZD pairs. First, check the trends on the larger time frames like, H4, D1 and W1 on the NZD pairs. If a good trend is in place or developing on the higher time frames, then that pair is a candidate for a trade.

Then set an audible forex price alert on the smaller time frames so that you can be notified of any breakouts to intercept the next movement. When the price alerts hit check The Forex Heatmap® forex heatmap for consistent NZD strength or weakness to confirm the entry. Make sure the price target is at least 100 pips away to preserve risk to reward ratio for each trade. Along with audible price alerts, we also have other other professional forex alert systems to notify traders when the forex market is moving.

New Zealand Dollar NZD Trading Signal

New Zealand Dollar NZD Trading Signal

New Zealand Dollar NZD Trade Entry

New Zealand Dollar NZD Trade Entry

See the example trade above. On this trading day the EUR/NZD dropped 250 pips. Other trades like buying the NZD/USD were possible on the same day, based on the NZD strength in the market. Hundreds of pips of movement across the NZD currency pairs occurred on this day. If the EUR/NZD is in a downtrend, or if the NZD/USD is in an uptrend, even more pips are possible going forward, along with these strong intraday movements.

Most forex traders never look at trades like this due to their using technical indicators and following only one pair, the EUR/USD. If traders are able to change their thinking and start to follow groups of pairs and setting up these indicators, traders can increase pip totals substantially.

Summary and Conclusions: Forex traders should follow the New Zealand Dollar NZD pairs and trade them. These pairs are overlooked by most traders, but these pairs have great characteristics and high potential to make pips. We have provided traders with the best possible setup of indicators in this article for success trading these pairs. The methods and indicators you see in this article also work for a total of 8 currencies and 28 pairs.