In this article we will show traders one live currency strength indicator, and we will also explain how to leverage some simple trend indicators into a currency strength indicator for overall market analysis. Then, the trader can incorporate currency strength and weakness into their market analysis and trade entry points. Substantially more pips and profits will be the result.
The currency strength indicator methods we will show you leverage the fact that currency pairs are made up of two individual currencies. We will show all forex traders the importance of analyzing each currency in a pair separately.
When one currency is moving up and another is neutral or moving down in the same pair, a trader can generate pips and profitable trades from this scenario. We will show traders how to set up their indicators to give us this information, trade after trade. Traders can generate profits on a real time basis and over longer time periods, using the individual currency strength and weakness information. The techniques and indicators shown below are effective on all of the major currencies like the USD, CAD, EUR, CHF, GBP, JPY, AUD, and NZD, for a total of 28 pairs.
Currency Strength Indicator Versus Technical Indicators
Most forex traders use the standard technical indicators, which are based on currency pairs, not individual currencies, and just one time frame. This is a fundamental flaw and wreaks havoc on most forex traders. With this type of indicator setup a trader cannot see whether or not the individual currencies that compose the pair exhibit individual currency strength and/or weakness. Standard forex technical analysis indicators measure parameters for the entire pair, not the individual currencies. The Fibonacci, RSI and Stochastics and anything like this are totally unreliable for forex trading and do not measure individual currency strength and weakness. Indicators like this cause great confusion among forex traders.
Real Time Currency Strength Indicator
There are two types of currency strength indicators, real time and trend based. A real time currency strength indicator is for current market conditions and to assist with easily entering trades. There are some very complicated real time currency strength indicators, but the one you see below is quite simple and effective.
Currency Strength Indicator
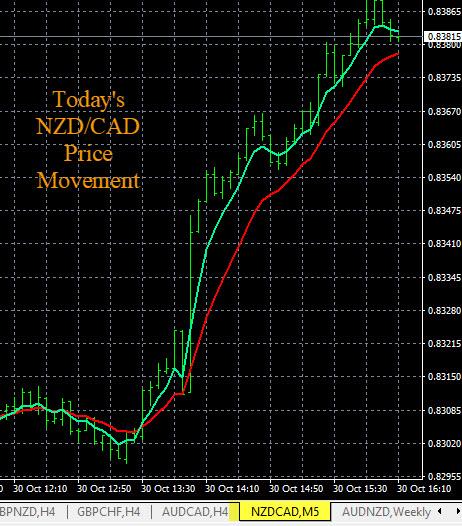
Currency Strength Indicator Price Movement
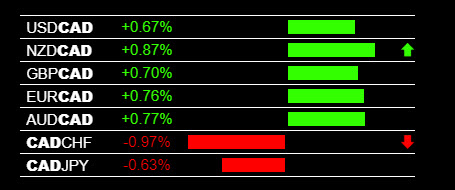
This real time currency strength indicator makes it obvious which currencies are strong or weak and will give any trader validated trade entries in real time. This currency strength and weakness indicator is called The Forex Heatmap® forex heatmap. It works best when trading in the direction of the major market trends. This indicator can also be used for short term day trading or short term trading against the trend on the smaller trends and time frames.
The example real time currency strength indicator you see in the image above is for Canadian Dollar (CAD) currency weakness, pointing you to a sell on the CAD/CHF or a buy on the GBP/CAD. But the The Forex Heatmap® also provides similar currency strength and weakness signals for a total of 8 currencies and 28 pairs. The signals are real time and 8 currencies are viible on a single web page for quick market scans.
Currency Strength Indicator For Market Trends
The second method of measuring or calculating individual currency strength and weakness can be easily done with some simple trend indicators. Understanding the condition of the total market across various individual currencies is one a great strategy to minimize risk. When an individual currency has a strong direction, all you have to do is make sure you are trading in that direction to minimize risk.
Set up some very simple forex trend indicators then analyze the indicators on the higher time frames, like the H4 time frames and larger. Then look for consistency.
Currency Strength Indicator
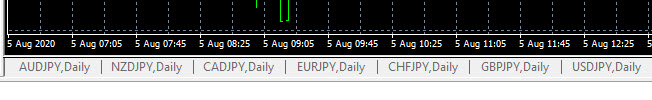
Look at the simple example above for the JPY pairs: Set up the JPY pairs side by side on your charts. If all of the JPY pairs are trending higher on the D1 (Daily) time frame, you know the JPY is weak. Therefore all of the JPY pairs should be moving higher and this is the direction you should trade in, following the larger trends and market momentum.
Currency Strength Indicator D1 Time Frame
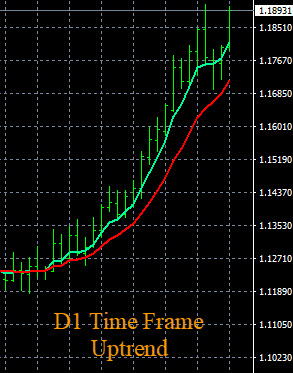
Traders can set up their charting platform to group all of the JPY pairs together so consistent currency strength and weakness is much easier to see. Then you can repeat this process for any currency, like the EUR pairs, USD pairs, etc. This strategy alone will change the way you think about the forex market. Anyone can perform this type of currency strength analysis, even beginner traders, in 10-15 minutes or less for a few currencies. Exponential moving averages like these shown below, applied to larger time frames like the H4, D1 and W1 time frames will work just fine. If you want to take it to the next level, you can fill out our forex market analysis spreadsheet every day and have a completely professional market analysis.
After you have a handle on the market trends, you can use The Forex Heatmap® to assist with you live trade entries. The heatmap confirms your trade entries with currency strength and weakness in real time. With the heatmap as your real time currency strength indicators, you are looking for consistent signals, like the CAD weakness example shown above. Anyone can read and interpret the heatmap, even beginner forex traders.
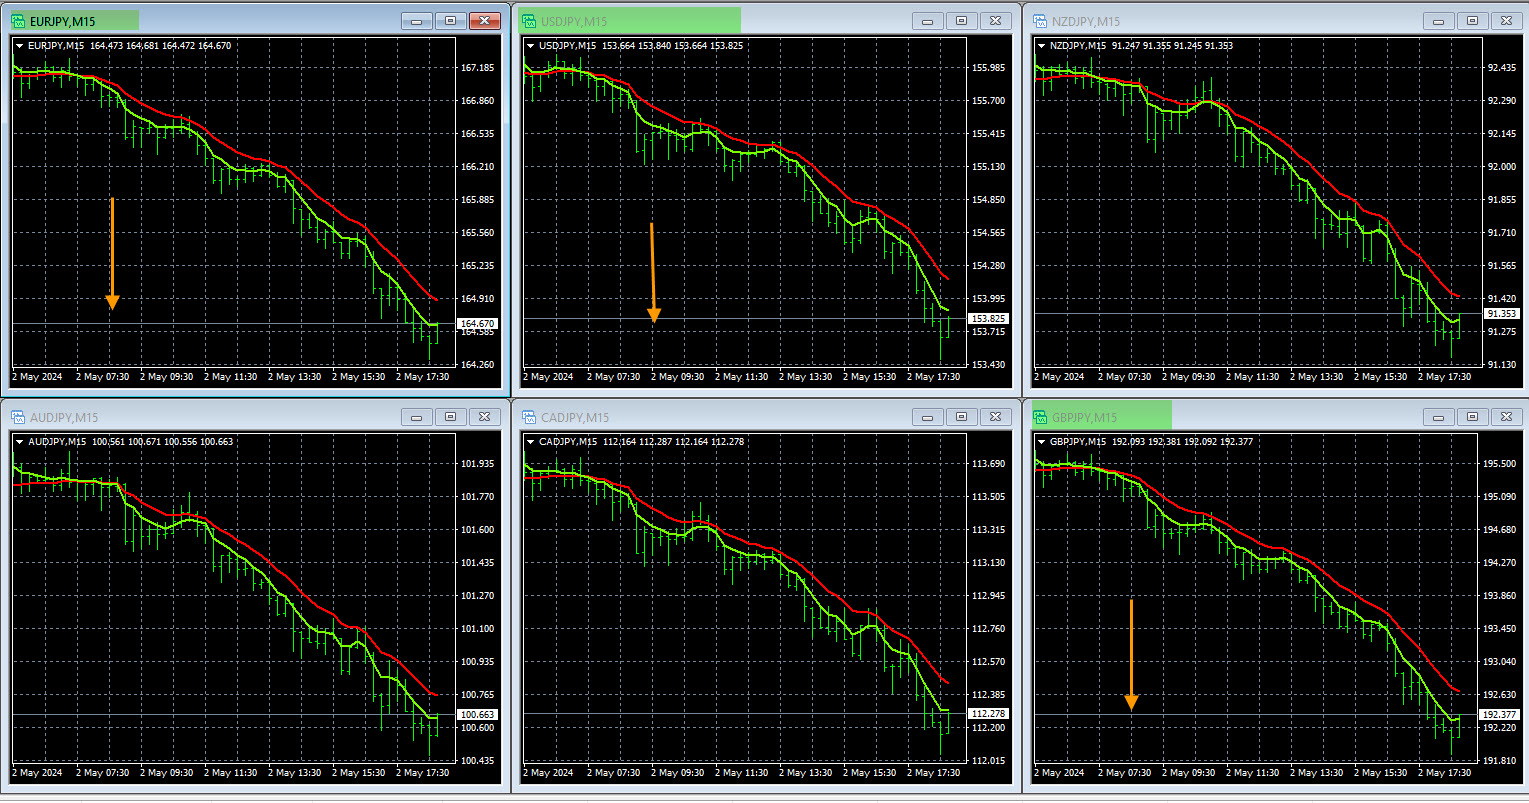
Currency Strength Indicator JPY Charts
Currency Strength Indicator JPY Pairs
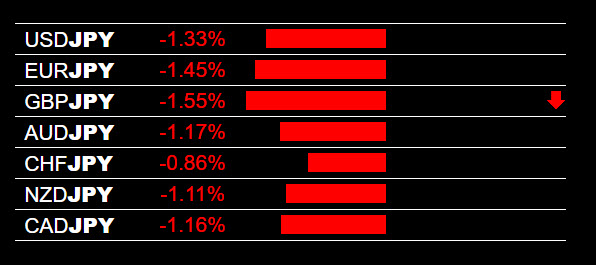
In this heatmap example it is clear that the Japanese Yen (JPY) strong. The strategy here is to pair JPY strength with another currency that is neutral or weak, for more accurate trade entries. In this case, having the right indicators and using them correctly to make successful trade entries, like selling the GBP/JPY or the EUR/JPY, will improve your trade entries dramatically. Profitable forex trade entries are now possible with tools like this. Just match a strong currency with a weak currency in real time and you have a potential entry. Combined with the currency strength chart setup for consistency, you now have the best forex trading system available.
This heatmap strength indicator an easy to interpret data visualization tool for real time currency strength. It organizes the information from 28 currency pairs into a visual map of the market for accurate trade entry decisions. When you know the overall market condition, naturally your trade entries will improve. If you can match up an entry point with a pair that is trending you and safely enter the trends of the forex market and the trade will move into profitability in real time. You then have a chance to ride the trends for several days or possibly weeks in a trending market.
To round out your currency strength indicator system just add one more criteria, support and resistance. If you enter a trade and there is no support or resistance nearby, your odds increase again of making a lot of pips and holding on to the trade until you’re the next major support or resistance is hit on that pair. You can check support and resistance levels easily on any pair in just a couple of minutes.
Should Forex Traders Use A Currency Strength Indicator ?
Most definitely, yes. The primary reason for traders to use any currency strength indicator or strategy is that the alternative methods, like technical indicators, simply don’t work. You will never know when not to trade or when conditions are favorable to trade with standard technical indicators. Another reason is that you will always know the condition of the overall market using these two currency strength indicators, and you will not have to click on a bunch of charts for a real time analysis of the market. Using currency strength and weakness keeps the emotions out of your trade decisions and emotions give way to using market logic to govern your trades. Currency strength trading is straightforward and any forex trader can learn it, even beginner currency traders.
Trend based currency strength indicators are for market analysis. They are for analyzing individual currency trends, and are for the larger picture or overall market analysis. Using a real time currency strength indicator with tools like the heatmap are for managing your trade entry.