- Categories
-
Recent Posts
- High Confidence Gold Trading System
- Fine Tuning Your Forex Trade Entries
- GBP/CHF, EUR/GBP Example Trade Entry
- Live Trading Capital: Funded Forex Account, Forex Funding
- Forex Mobile App On Telegram
- Forex Scanner, Real Time Screening Signals For 8 Currencies
- Forex Audio Book, MP3 Library
- Forex Trading Seminar — Can I Become A Forex Trader?
- GBP/JPY Trend Reversal
- Forexearlywarning, Introduction To Our Complete Trading System
Category Archives: Trend Analysis, Support and Resistance
- GBP/JPY Trend Reversal
- EUR/AUD Trend Analysis
- USD/CAD Trading Plan
- EUR/USD Resistance Price Breakout
- CAD/CHF Chart Analysis
- EUR/CHF Trend Analysis
- EUR/USD Chart Analysis
- AUD/JPY Trend Analysis
- Forex Analysis EUR/CAD H4 Chart
- EUR/NZD Chart Analysis
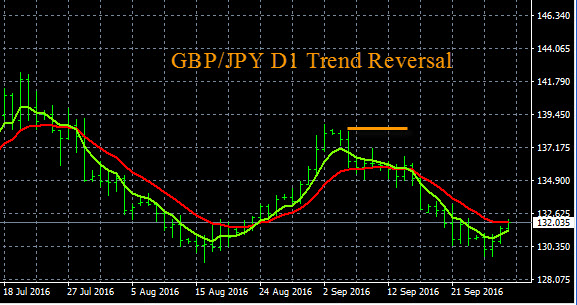
GBP/JPY Trend Reversal
A GBP/JPY trend reversal may be underway on the D1 time frame. Look for a buy signal on this pair in the main session starting tomorrow morning. You can watch The Forex Heatmap® to confirm any buys and also the live heatmap alert system. Current pricing is in the 132.00 area, overall pip potential is up to the 138.00 resistance area, noted on the chart. This is a ranging currency pair, and the chart looks like a forex reversal pattern and double bottom change of direction off of heavy support on one of the larger time frame. If you see consistent GBP strength or JPY weakness on the heatmap, this would be your confirmation to buy this pair
GBP/JPY Trend Reversal
Posted in Trend Analysis, Support and Resistance
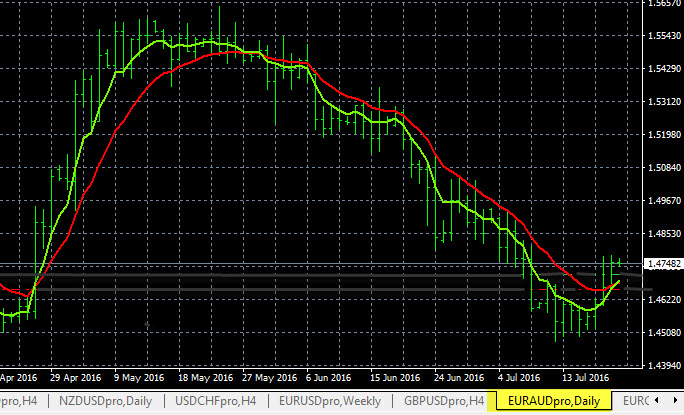
EUR/AUD Trend Analysis
The EUR/AUD trend analysis is below. This pair is forming a new uptrend on the D1 time frame. Traders can set an audible buy alert at the 1.4775 level. The upside potential on this new trend is as high as the 1.5500 resistance level, so entering this trend has excellent upside potential. When the price alert hits check The Forex Heatmap® forex heatmap for trade entry verification signals.
The trend charts you see for the EUR/AUD are exponential moving averages which are easy to set up. These trend indicators can be used to follow the major trends of the forex market and our trend based trading plans. The chart pattern on this pair looks like a double bottom, which is a reversal pattern off of support, click on the link to learn more about this forex reversal pattern along with other forex trading patterns.
EUR/AUD Trend Analysis
Posted in Trend Analysis, Support and Resistance
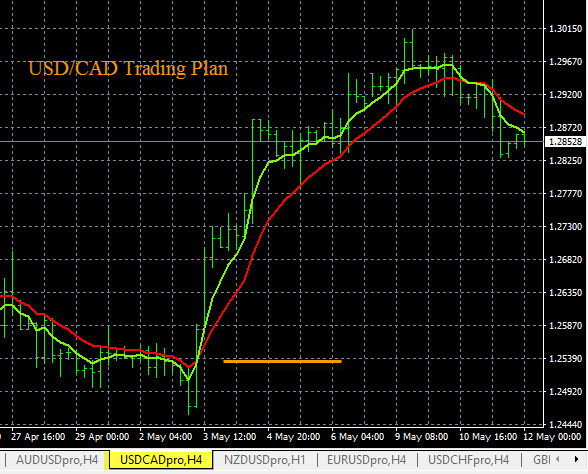
USD/CAD Trading Plan
The USD/CAD trading plan for the current market condition is as follows. This pair is currently trendin down on the H4 time frame and the D1 time frame trend could follow. Traders can set an audible price alert at 1.2830 on this pair. Wen the price alert goes off look for a sell signal on this pair in the main session on The Forex Heatmap® forex heatmap. This pair has very good poential to drop down to the 1.2550 support area, which is noted by the yellow line. So this is 280 pips of potential, excellent risk/reward ratio
This trading plans was prepared using multiple time frame analysis by individual currency, and we are detecting some CAD (Canadian Dollar) strength in the market now to drive the movement. We use this method to analyze 28 pairs for ou daily forex trading plans at Forexearlywarning.com.
USD/CAD Trading Plan
Posted in Trend Analysis, Support and Resistance
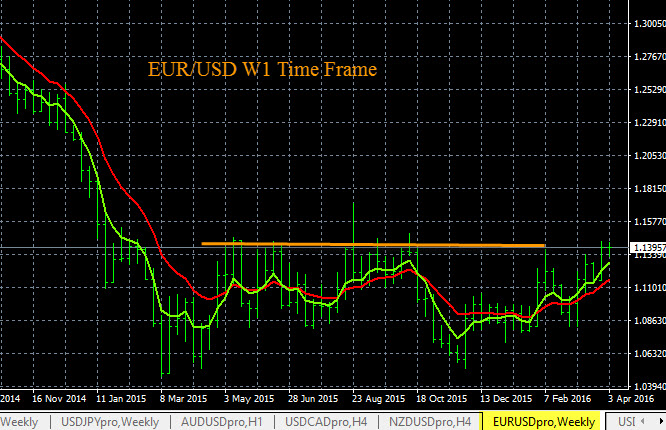
EUR/USD Resistance Price Breakout
The EUR/USD has a resistance price breakout point at the 1.1425 area or just above there. All forex traders can set an audible price alert there. The EUR/USD is currently in a cluster or zone of support and resistance. The audible price alert would keep traders notified of a potential price breakout. When the price alert hits you can check The Forex Heatmap® for a confirmation buy signal. Look for consistent EUR strength, or USD weakness, or both on the heatmap when entering the buy trade.
The EUR/USD has substantial upside potential and a new trend should form on the larger time frames above the breakout point, and also possibly on the MN time frame. The W1 time frame is pictured below. We use forex support and resistance levels combined with simple exponential moving average trend indicators to plan all of our trades across 28 pairs.
EUR/USD Resistance Price Breakout
Posted in Trend Analysis, Support and Resistance
CAD/CHF Chart Analysis
The CAD/CHF is trending higher on the D1 time frame. The chart below shows the D1 time frame on this pair. Traders can set a price alert for a buy at 0.7330 on this pair, as noted by the yellow line. When the price alert hits, you can check The Forex Heatmap® for a confirmation buy signal. The confirmational buy signal would be consistent CAD strength or consistent CHF weakness, or both.
The upside pip potential is very good, to as high as the 0.7700 area, as noted on the chart. This is about 370 pips of upside potential from here, which is excellent money management ratio. The chart analysis was performed using multiple time frame analysis by individual currency. We use multiple time frame analysis, then apply this analysis method to groups of individual currency pairs like the all seven CAD pairs or all seven CHF pairs we follow to perform the analysis. The trend indicators are 5/12 exponential moving averages.

CAD/CHF Chart Analysis
Posted in Trend Analysis, Support and Resistance
EUR/CHF Trend Analysis
This is a trend analysis of the EUR/CHF pair using our exponential moving averages. The larger time frames like the W1 time frame shown below illustrate that this pair is trending higher. This pair has broken most near term resistance and now has significant upside potential.
Traders should set an audible price alert at at 1.1070 for a resistance breakout. When the alert hits check the Forex Heatmap® forex heatmap for a confirmation buy signal. These moving averages are easy to set up and we use them on all 28 pairs we follow. We use multiple time frame analysis for trend analysis and incorporate support and resistance levels into our analysis for price targets. Doing this and combined with good money management are the keys to profitable forex trading.

EUR/CHF Trend Analysis
Posted in Trend Analysis, Support and Resistance
EUR/USD Chart Analysis
The EUR/USD chart and trend analysis shows that the W1 time frame is starting to trend to the upside. The current resistance level is at 1.1490, denoted by the yellow line. Traders can set an audible price alert here.
When the price alert hits check The Forex Heatmap® to verify any buy trades. Confirm the buy entry with EUR strength or USD weakness on the forex heatmap. Past the current short term resistance level at 1.1490 we see no nearby resistance. The overall upside pip potential is considerable. The chart you see below is a meta trader platform with easy to set up 5/12 exponential moving averages. We use multiple time frame analysis for the analysis.

EUR/USD Chart Analysis
Posted in Trend Analysis, Support and Resistance
AUD/JPY Trend Analysis
This is our AUD/JPY trend analysis using the W1 time frame. The analysis indicates that this pair has a resistance breakout point at 96.50 on the W1 time frame. Traders can set an audible price alert here on your trading platform. Above that price when the price alert hits, we would be looking for a buy signal on The Forex Heatmap® forex heatmap. The next major resistance point past the alert price is around 102.00, noted by the yellow lines. So the overall pip potential is around 550 pips, which is an excellent risk/reward ratio for this trade.

AUD/JPY Trend Analysis
Posted in Trend Analysis, Support and Resistance
Forex Analysis EUR/CAD H4 Chart
The EUR/CAD chart analysis on the H4 time frame shows one resistance level at 1.4120, see yellow line on the right. Traders should set an audible price alert here for an upside price breakout. When the price alert hits then you can confirm any buys with The Forex Heatmap® forex heatmap and check for consistent EUR strength or CAD weakness, or both.
The upside potential on any buy trades is to the next resistance area at the 1.4400 area, see the yellow line on the left. This is nearly 300 pips of upside potential, which is the benefit of working with the higher time frames like the H4 and larger.
The free forex indicators you see below are for monitoring market trends. Thy are a basic open high low close barchart with some very simple 5/12 exponential moving averages attached to the EUR/CAD on the H4 time frame.

Forex Analysis EUR/CAD H4 Chart
Posted in Trend Analysis, Support and Resistance
EUR/NZD Chart Analysis
The EUR/NZD chart analysis is shown below for the H4 time frame. The EUR/NZD is currently consolidating inside of a price range. We are setting price alerts on either side of the support and resistance cluster to detect movement and to detect when this pair will form a new trend going in either direction. The alert points are shown by the yellow lines on the chart you see. This is called a straddle alert.
There is very good pip potential past both price alert points in either direction, and you can see the pip potential on the chart image below. If this pair falls it has as much as 500 pips of potential to the next support. When the price alert hits check the The Forex Heatmap ® for consistent EUR or NZD strength or weakness to verify the buy or sell.

EUR/NZD Chart Analysis
When a currency pair is inside of a cluster on any of the larger time frames, it is best to not trade that pair. You should set price alerts on either side of the cluster to detect a breakout in either direction, especially when the pip potential is large, like in the example above. This technique works on any pair. When the price alert hits you can always check The Forex Heatmap® forex heatmap to verify any trade entries. By trading 28 pairs you can avoid clusters and move to another pair or another currency until this pair breaks out in either direction.
These forex indicators for monitoring trends are a very simple and easy to set up charting system. Traders can use them to perform their market analysis. They are exponential moving averages set up on a 5 and 12 time period.
Posted in Trend Analysis, Support and Resistance