
- Categories
-
Recent Posts
- High Confidence Gold Trading System
- Fine Tuning Your Forex Trade Entries
- GBP/CHF, EUR/GBP Example Trade Entry
- Live Trading Capital: Funded Forex Account, Forex Funding
- Forex Mobile App On Telegram
- Forex Scanner, Real Time Screening Signals For 8 Currencies
- Forex Audio Book, MP3 Library
- Forex Trading Seminar — Can I Become A Forex Trader?
- Why Strength/Weakness Works Best For Forex Trading
- Forexearlywarning, Introduction To Our Complete Trading System
Category Archives: Uncategorized
Forex Market AUD Weakness 12-12-2013
Today in the forex market the AUD was weak on all pairs. This drove movement on this entire group of pairs. There was also some USD strength in the market today, and the AUD/USD dropped considerably down to one major support level. Based on the current trends on this pair, it should break this support level and continue lower. The AUD weakness in the market today is shown below on our real time trade management indicator, The Forex Heatmap®.
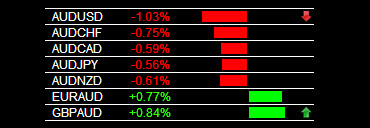
Forex Market AUD Weakness 12-12-2013
Posted in Uncategorized
Forex Trend Analysis CAD/CHF 12-11-2013
The CAD/CHF has been in a down trend for nearly three weeks and is stalling at support. Based on an analysis of the CAD pairs we are now looking for a reversal back up on this pair. We are now looking for CAD strength to return to the market. You can begin to look for buy signals on this pair in the main trading session tomorrow morning using The Forex Heatmap®. We are looking for the reversal on the H4 time frame and in a day or two on the D1 time frame as well. This forex analysis of trends was performed using multiple time frame analysis using parallel and inverse pairs. These market analysis techniques are the best available for forex market analysis.
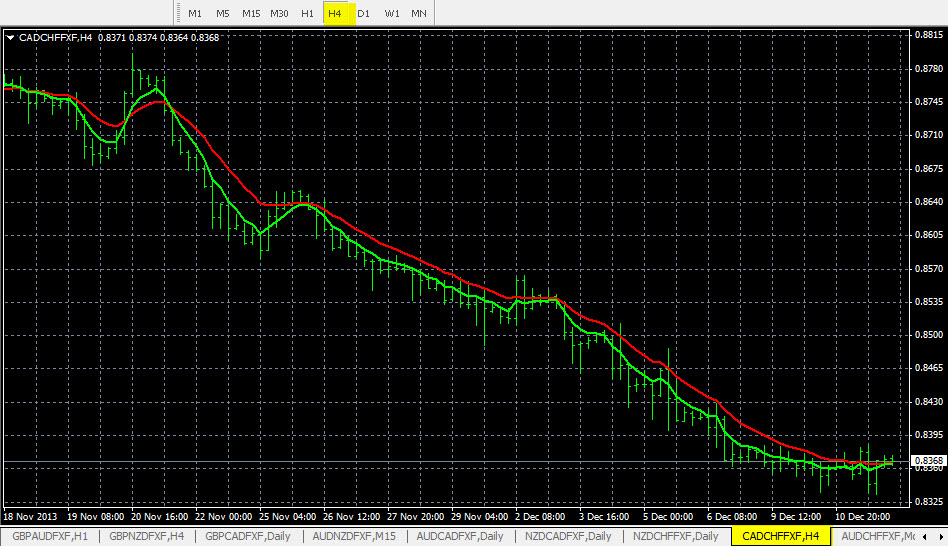
Forex Trend Analysis CAD/CHF 12-11-2013
Posted in Uncategorized
Crypto Currency Heatmap For Trade Entry Management
Forexearlywarning has a live crypto currency heatmap, a visual map of the top crypto currencies, to assist with trade entry management on any high liquidity crypto currency.
The crypto currency heatmap has the following crypto currencies BTC, ETH, XRP, ADA and works in real time 24 hours per day, 7 days per week. Visual map of the crypto currency market.

Crypto Currency Heatmap
The heatmap shows you when the entire crypto market is going in one direction based on the direction of the major crypro currencies. When you enter a crypto currency trade you can confirm the trade with real time market momentum.
We recommend trading reversals with this live system to mimize risk when trading the spot crypto market or market or perpetuals. Wait for a crypto currency to cycle down on at least the H2 time frame, then check some of the other major crypto currency pairs. When the market starts to reverse back to the upside verify themarket momentum with the heatmap before setting any buy trades.
The Crypto Currency heatmap works on sells also.
Example Sell Trade
In the example below BTC bitcoin cycled up and is stalling at resistance. When this happens on at least the H2 time frame you have a swing trade setup for a sell. When the market momentum shifts and the H2 moving average crosses for a possible sell, you can sell BTC off of the smaller time frames plus full confirmation from the heatmap. This is a low risk was to verify any sell trades.
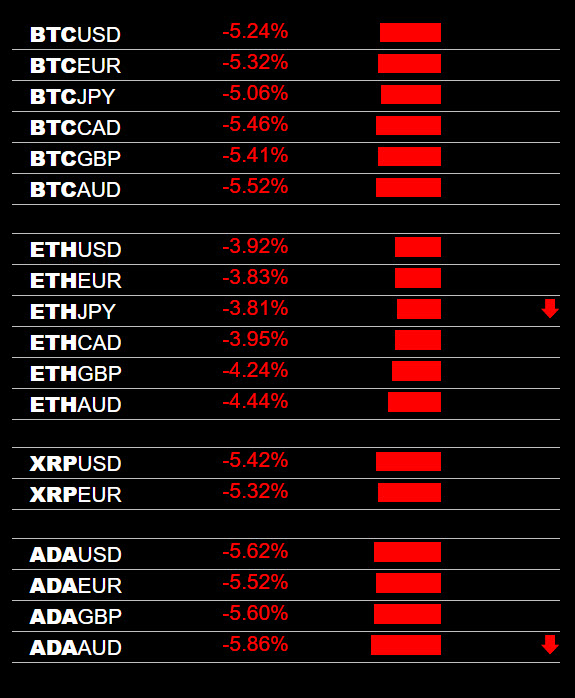
Bitcoin BTC Sell Signal
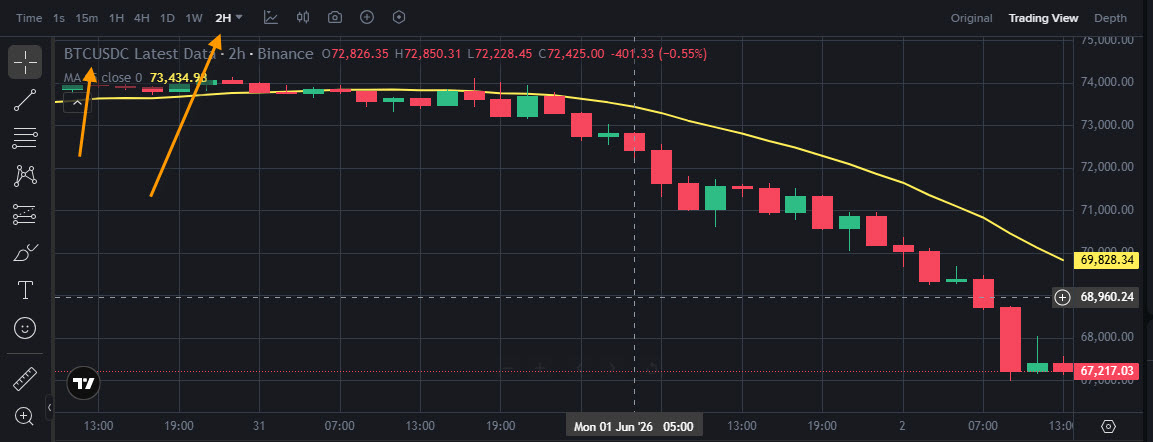
Bitcoin BTC H2 Time Frame
Trading Alert Systems
Most crypto currency charting platforms have price alert systems for monitoring breakout points. You can set price alerts at obvious breakout points, then when they hit check the overall market for momentum in one direction then execute a buy or sell trade. You can also set price alerts at target areas for closing out your trades at significant support or resistance levels.
Chart Setup
For swing trading you can use the H2 time frame or larger. Chart setup is easy to install on any charting platform. Set up a 15 period Exponential Moving Average (EMA) with small offset as shown below in the image. Binance charting system is pictured below, but same setup works on any reliable charting system.
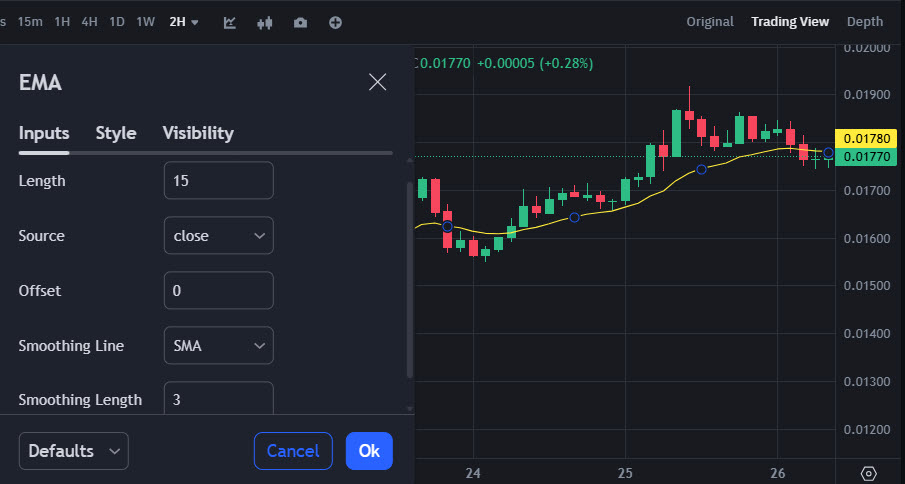
Cryptocurrency Moving Averages
Why Would You Use a Crypto Market Heatmap
Crypto upcycles and downcycles, and associated revrsal points tend to move in tandem. This is why the heatmap approach works so well to reduce risk on trade entries. Most of cht crypto currency market is correlated. Traders should perform an overall market analysis on several crypto pairs and when the reversal points start in either direction, you can watch the heatmap and snaller time frames to catch trade entries with full mrket momentum backing each entry point.
Notes For Crypto Investors
If you are not a crypto currency trader but more of an investor you can still use some simple methods to build positions in the high utility crypto currencies you believe in. When the crypto market goes into a bear market like it did in 2025 and early 2026 you can build positions ove time by buying the bigger dips on the larger time frames.
Posted in Uncategorized
Forex Trading Returns Using Leverage
When you use leverage to trade the forex market your returns can be much higher than most typical non leveraged investments or non-leveraged trading. You only have to put up a small amount of money to control a much larger amount. Small movement can result in much larger percentage profits. Losses can be managed with stop orders and moving stops to breakeven. To open a leveraged position, you only need to deposit a fraction of the total trade value, called the margin.
Example Leveraged Forex Trading Return Calculation #1:
Account balance: $10,000 USD
Pair: EUR/USD Buy
Deposit Amount for Trade: $1000 One Standard Lot
Leverage: 100:1
Position size: $100,000 which is $1000 x 100
Scenario: Market moves +75 Pips In Your Favor
Profit: $750
Return on Investment: 75% which is $1,000 profit divided by $1,000 initial investment
Total Return on Account: Since account starting balance is $10,000 return on account including non-margined funds is $750 divided by $10,000 which is 7.5%.
If you make 4 trades in one month with 75 Pips return each on EUR/USD your account balance will be $13,000 at the end of the month which is a 30% return on the total account.
USD IMAGES READY
Example Leveraged Forex Trading Return Calculation #2:
Account balance: $10,000 USD
Pair: GBP/JPY Sell
Leverage: 50:1
Deposit Amount for Trade: $2000 One Standard Lot
Position size: $100,000 which is $2000 x 50
Scenario: Market moves +200 pips in your favor
Profit: $133 sounds way too low
Return on Investment: 6.6% which is $133 profit divided by $2,000 initial investment.
Total Return on Account: Since account starting balance is $10,000 return on account including non-margined funds is $133 divided by $10,000 which is 1.33 %.
If you make 2 trades in one month with 1.33% return each on GBP/JPY your account balance will be $10,266 at the end of the month which is a 2.66 % return on the total account.
GBP/JPY IMAGES READY
Risk Management
these examples are simplified to focus on the mechanics of leverage in forex gains.
Posted in Uncategorized
Most Effective Forex Chart Setup For Traders, See the Pips
Forex traders struggle to make pips because they cannot see the pips. With this effective forex chart set up you will see the pips much more clearly and open up the door to increasing your pip totals across 8 currencies and 28 pairs.
Examples Of This Logical, Effective Chart Setup
Here are two examples of this chart setup for the AUD and USD currencies. You can duplicate this chart setup for the top 8, most liquid currencies total with up to 7 charts on one screen.
Click on any image below to expand to full screen.
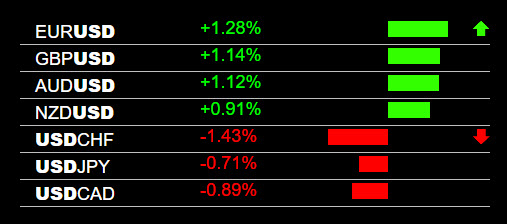
Most Effective Forex Chart Setup USD Weakness
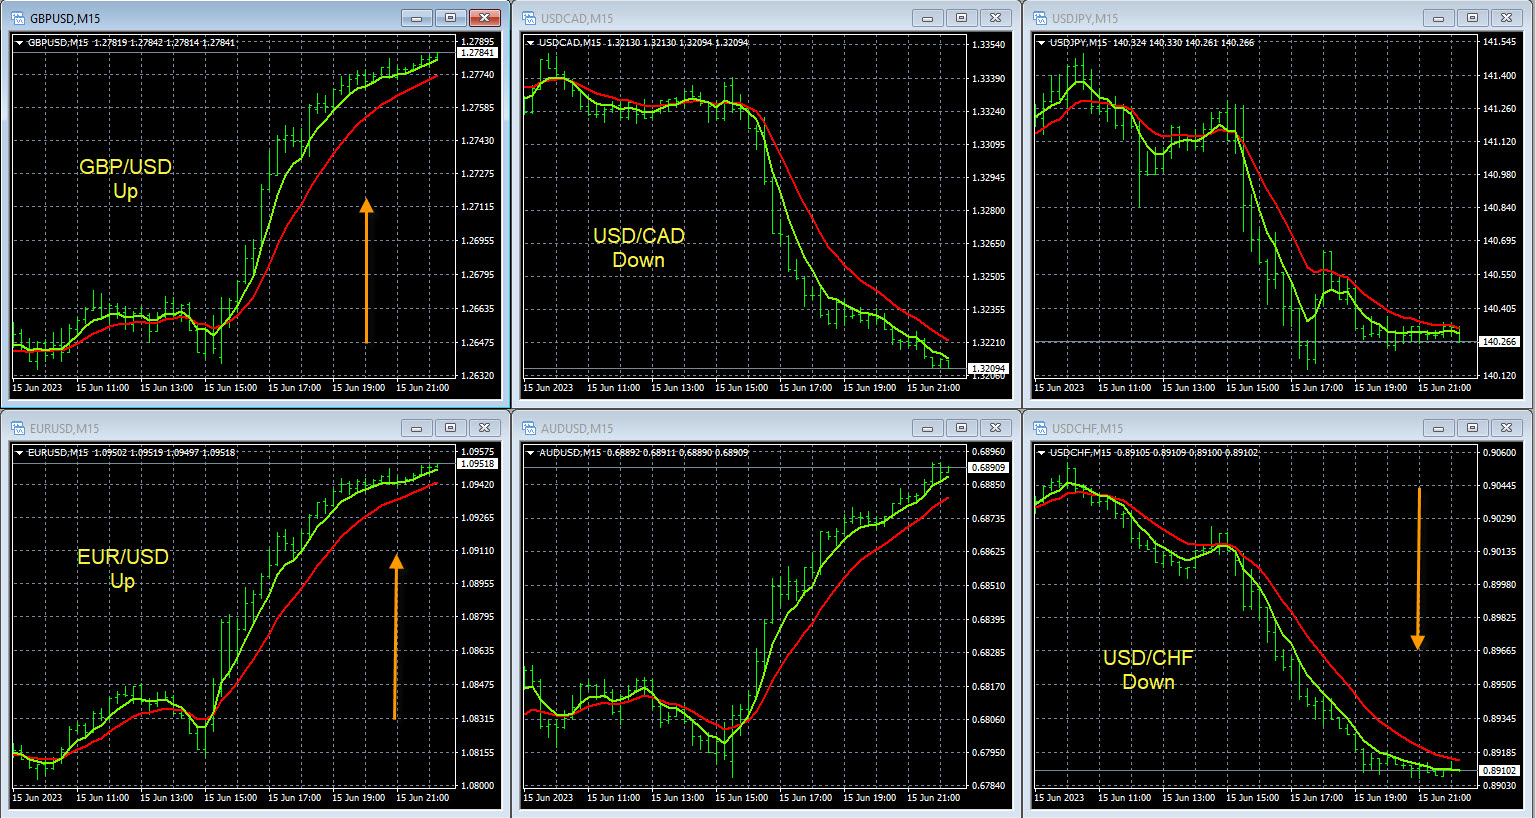
Most Effective Forex Chart Setup USD Pairs
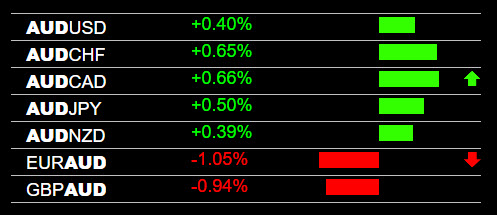
Most Effective Forex Chart Setup AUD Strength
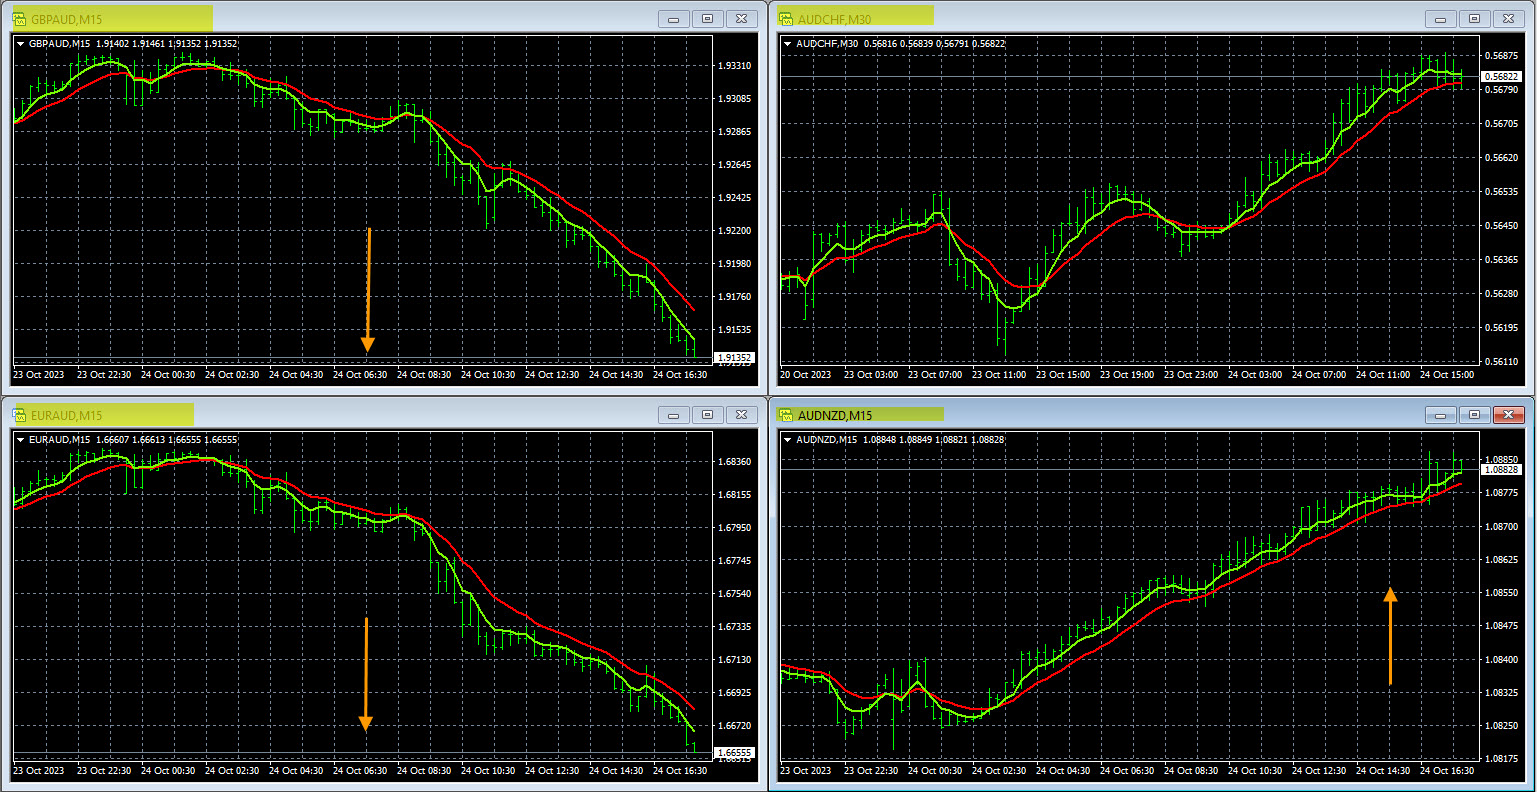
Most Effective Forex Chart Setup AUD Pairs
You can see all the AUD and USD pairs lined up side by side with our live signal system. The Forex Heatmap®. It is clear that the USD weakness and AUD strength is driving the movment in real time. The currency pairs moving the fastest will always be the strongest versus the weakest, day after day. If you enter a buy or sell trade you can check the higher time frames to see if the pair is trending.
Why Would Forex Traders Set Up The Charts This Way?
Individual currencies drive the movements in the forex market. If one currency is consistently strong or weak in real time you should look for pips there. This is an irrefutable fact. But forex traders suffer because they simply ignore this fact and use technical indicators, do risky news trading or random trade entries and guessiing. This indicator and chart setup is totally logical.
How To Set Up Your Charts This Way
Traders can set up their forex charts on any time frame with up to 7 pairs on each screen using the metatrader profiles. Set up the charts like you see above on the smaller time frames to guide your trade entries, then set them up on the larger time frames to see the overall trends and look for price targets. We recommend this setup for the top 8, most liquid currencies. USD, CAD, EUR, GBP, CHF, JPY, AUD and NZD pairs, 28 pairs total.
Fast Navigation, Currency To Currency
If the action is heating up on more than one currency, you can navigate through the charts quickly from currency to currency. Simply click on the hotkeys on your keyboard or use the dropdown menu in metatrader to move through the profiles on any time frame. Very simple but usually ignored by most traders. Ctrl F5 and Shift F5 hotkeys can be used to navigate up to 7 charts at a time.
When To Check The Forex Market For Strong Movement
Most of the significant market movements occur in the main trading session, and a few times per month in the Asian session or at other times during the day. If you use the news calendar and our other professional alert systems correctly, you can spend less time in front of the computer and still see most of the volatility in the forex market.
The New Forex Industry Charting Standard?
Forex traders are looking for better choices in their charting systems and trading systems. Setting up your charts by individual currency in this manner will become the standard for making pips in the future. Forex traders are consumed by technical indicators and are looking for better choices. They know technical indicators are ineffective and news trading is risky. This chart setup can be use on a permanent basis by any forex trader, instead of going from indicator to indicator week after week. Forex trades want logic, not more indicators.
Summary and Conclusions: Forex traders are looking for logical, consistent trading systems that go with the flow and momentum of the market. Top notch charting systems like this one will provide traders qualifying for funding the ability to see the pips much better and likely get their funding much easier, with much lower drawdown.
Posted in Uncategorized
Currency Strength Trading NZD/CHF Sell Signal
Today in the currency trading the NZD weakness and CHF strength drove the movement cycles on these groups of pairs. This caused the NZD/CHF to sell off in the main forex trading session.
As of right now at 1200 Noon Eastern Standard Time the NZD/CHF pair is hitting one strong support level. For trade management, we would scale out some lots, or possibly close out the trade completely. The currency strength trading signals you see below are shown on The Forex Heatmap®, which is a real time visual map of the forex that gives real time currency strength readings. If you would like to learn more about the forex heatmap you can read the forex heatmap tutorial, which will give more detailed information on how this great signal system works.
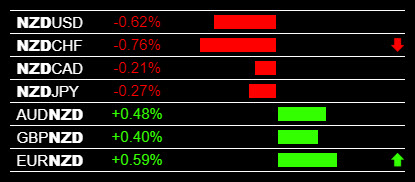
NZD Weakness NZD/CHF Sell Signal
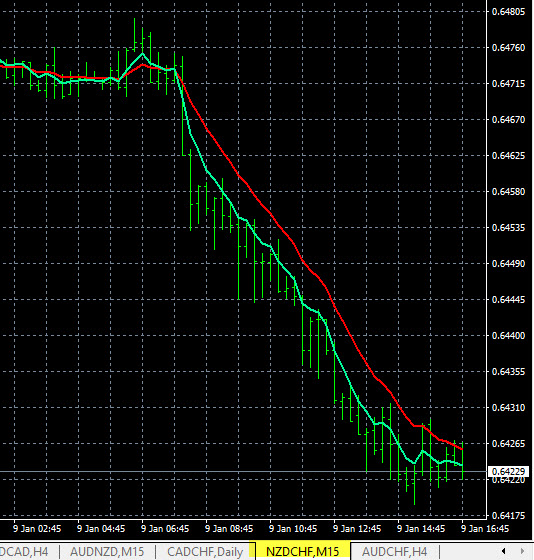
NZDCHF Price Chart And Movement
Posted in Uncategorized
Best Chart Setup For Forex Traders
The best chart setup for forex traders to use for highest visibility and highest profit potential is having multiple charts on one screen with one common currency. Compare this best in class charting system that leverages individual currencies to any other system to always know what pairs are moving in real time. We will show examples of how to set up the charts for the top 8 most liquid currencies and 28 pairs.
Why Set Up Your Forex Charts This Way?
Individual currencies drive the forex market. Each currency pair has two currencies and you must know the condition of each currency to safely enter trades. Technical indicators are completely flawed and ingnore this simple consideration. With the chart setups presented here traders will set the bar much higher for pip totals they expect to make.
Two Examples Of The Best Chart Setup
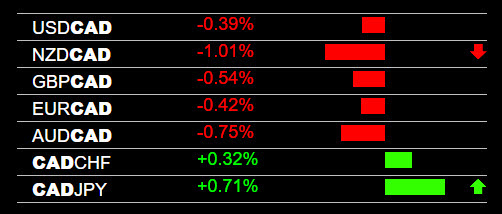
We use this chart setup for 8 currencies and a total of 28 different pairs. The examples below are for the CAD and USD pairs but this chart setup can be duplicated for the top 8, most liquid currencies.
Click on the chart images to expand to full screen.
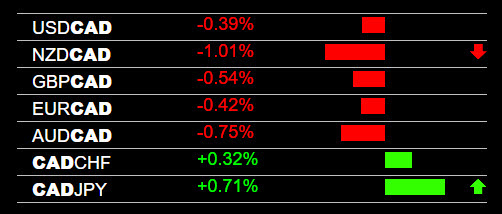
Forex Heatmap CAD Strength
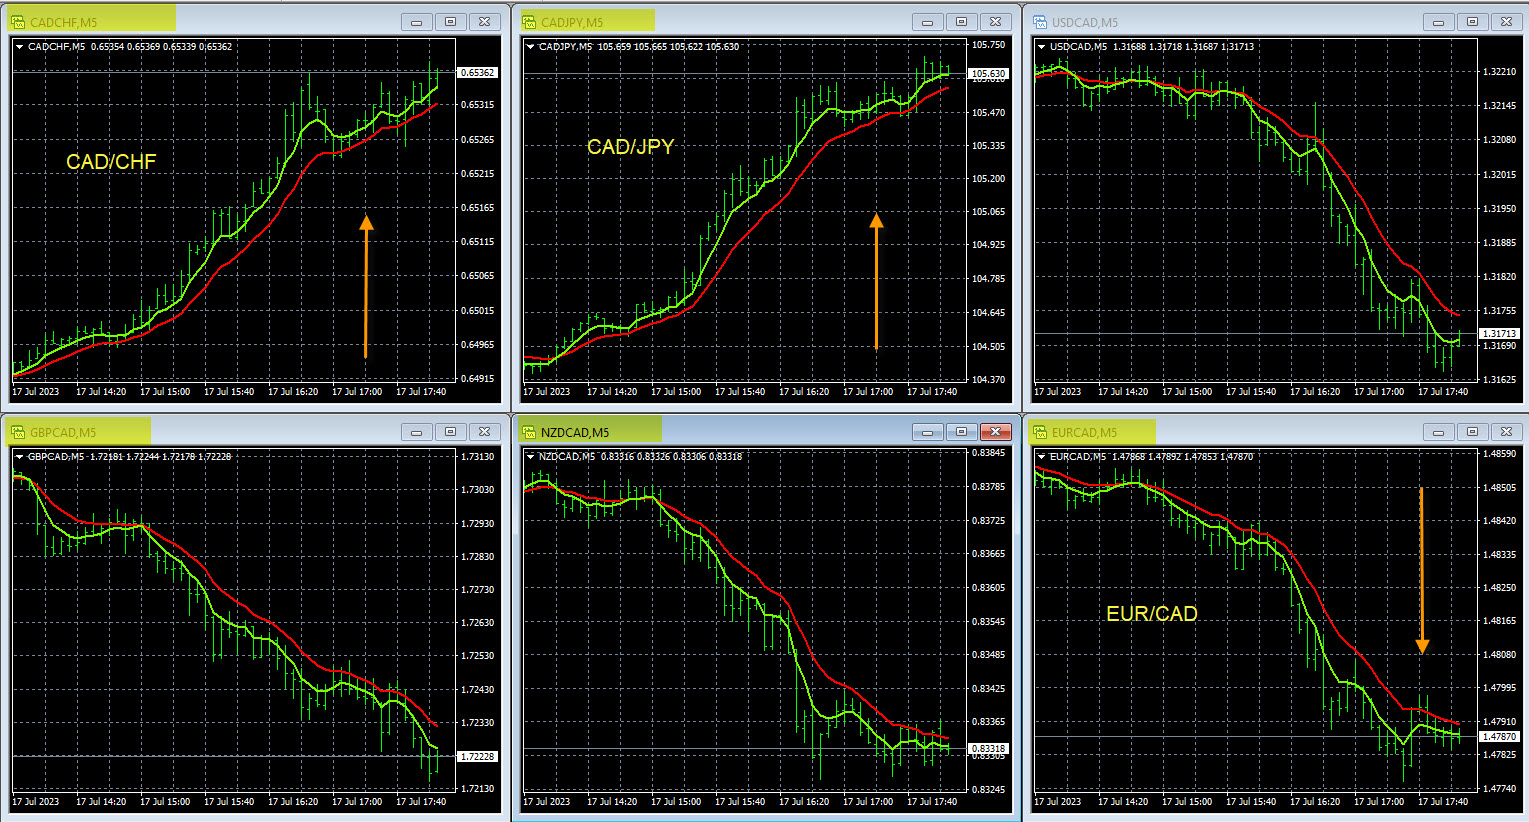
Best Chart Setup For Forex Traders – CAD Pairs
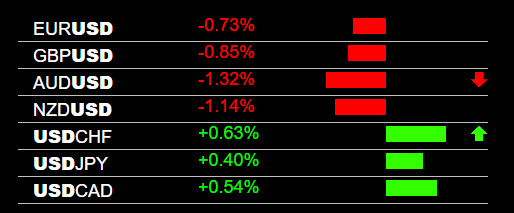
Forex Heatmap USD Strength
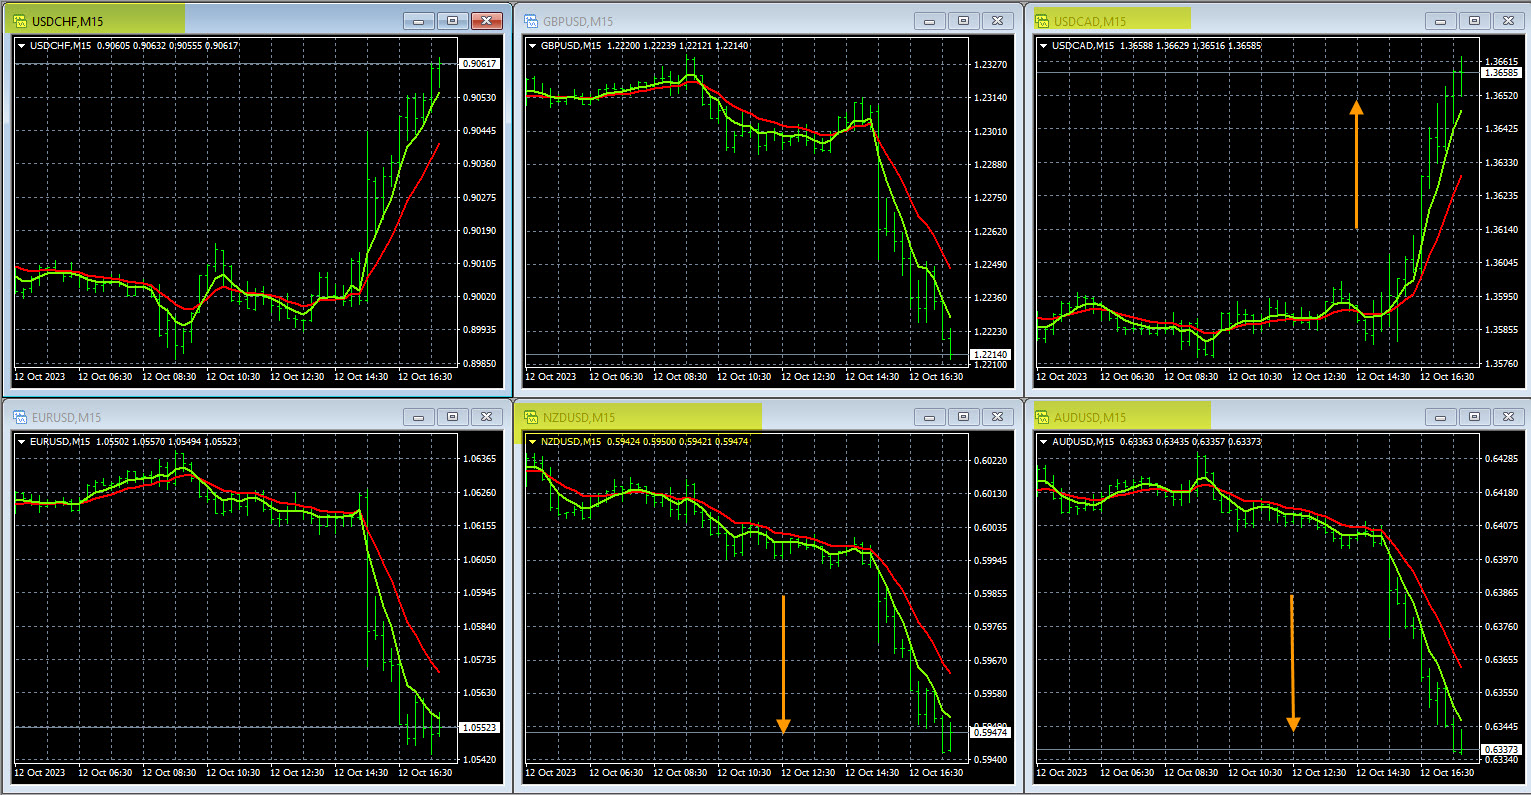
Best Chart Setup For Forex Traders – USD Pairs
The chart setups are consistent with our live market indicator, The Forex Heatmap®
Navigation is very fast from currency to currency. Traders can see to up to 7 pairs at a time on one sceen is easy using the hotkeys on your keyboard or via dropdown menu. Hotkeys are Ctrl F5 and Shift F5 keys. Use the smaller time frames plus the live heatmap signals for your trade entry management, then use the higher time frames like the H4 time frame and larger to check to see if the pair you are trading is trending up or down. We have a more complete discussion of what is the best time frame to use in these situations.
How To Set Up These Charts
The charts you see above can be set up using the Metatradr profiles functionality and features. Setting up the metatrader profiles can be done with these instructional videos. You can set up the charts using the lowere time frames for your trade entries to use with The Forex Heatmap. Traders can also use the same chart setup on the larger time frames like the H4 and larger to check the overall trends on the market.
Add Professional Alert Systems
Now you can set up our suite of professional forex alert systems to notify you as to when the market is moving. Whether it is the news calendar or our push alert system, we can notify traders of when the market is moving to spend less time in front of the computer while seeing the movements better on the charting system. Find out more about all of our alert systems and always be informed when the forex market is moving.
Summary and Conclusions: This forex chart setup is the best in class and all forex traders should use it. We present example charts here for two currencies. The same logic applies to 8 currencies and 28 pairs total. This professional, hedge fund quality chart setup will lead to successful trading, and is the most accurate chart setup available. Beginners or experienced traders will gravitate to this charting system and have a great understanding of how to make pips.
Posted in Uncategorized
Forexearlywarning Portuges
Bem-vindo ao Forexearlywarning Português. Este é o seu portal de suporte para clientes da Forexearlywarning que falam português. Aqui estão o endereço de e-mail de suporte e locais de mídia social:
Email suporte: suportefewbr<at>gmail.com at is the @ sign
Instagram: @fewbrasiloficial
Telegram: @Fewbrasiloficial
X (Twitter): @fewbrasiloff
Facebook: Forexearlywarning Brasil
Forexearlywarning Portuges
Sinais
Forexearlywarning Portuges
Charts
Clique nas imagens acima para ver a configuração do gráfico para os pares CAD com mais clareza. Sempre use os melhores sinais e configurações de gráficos na indústria forex e você verá os pips claramente em 8 moedas, USD, CAD, EUR, CHF, GBP, CHF, JPY, AUD e NZD, 28 pares no total. Forexearlywarning Portuges é uma empresa e entidade separada e não faz parte da MT2 Enterprises, LLC. A Forexearlywarning Portuges é gerida por W. Salazar e seus associados.
Posted in Uncategorized
Online Forex Trading System With Consistent Profits
Forex traders need a complete system for online forex trading. This article will provide any trader with a list of criteria that any great forex trading system should have. Traders can use these criteria to validate any online forex trading system. This will ensure that their trading is moving in the right direction quickly, towards profitability. We will provide traders with a list of what they need to screen a trading system, along with showing you what a complete trading system looks like.
When searching the web for an online forex trading system you will mostly find forex brokers and some education providers or coaching for a very large fee. This is not really an online trading system. It is easy to find a broker with web searches, they are all over the internet, this article provides a profitable online trading system that will work with any broker platform. A forex broker platform is not a trading system, it is simply a trade execution system. A trading system will give you everything you need to make profitable trades, regardless of who your broker is. This is what we will show you in this article.
Online Forex Trading System Components
First of all, there are several online forex trading systems to avoid. We would avoid any trading system provided by a broker, which will lead to repetitive trading and scalping. We would also avoid any trading system that is based on technical indicators. We would also avoid any online trading system that could not be easily explained and the details were not clear.
Here is a list of trading system components needed to obtain a goal of successful and profitable online currency trading:
1 – A forex trader would need a method to analyze the entire forex market or any individual pair, thoroughly and accurately. For this we suggest multiple time frame analysis by individual currency. This way a trader could determine if the pair they are considering trading is with or against the major trends of the market. We could also provide traders with a set of trend indicators that can be set up on any charting system. After you have completely analyzed the market trends you could draw up some simple trend based forex trading plans that are easy to follow.
2 – Alert systems for notifying traders when the overall market or any pair they are monitoring are moving is part of any great trading system. So you spend less time in front of the computer but can still catch the majority of the movements and good trades. An audible alert system combined with a forex news calendar should to the trick. We teach traders how to set forex price alerts. We also have visual alerts on our website to tell you when currencies are moving.
3- Traders would also need criteria for successfully enter trades and get into profitability, so they could move their stops and greatly reduce or eliminate risk trade after trade. Part of any trade entry management system would be clear signals like the ones you see below from The Forex Heatmap®. This is a buy signal for the AUD/CAD, this real time system works for 28 pairs, and the signals are easy to interpret.

Online Forex Trading System – CAD Weakness
4- Written methods to set stops and manage each trade, so traders can capture the pips they make. Money management techniques and determination of profit taking levels on a trade by trade basis should be included in any great online forex trading system.
5 – A full written tutorial and all education details to explain the system, along with some videos, so you have a practical guide to forex trading success with the system. And in case you have questions, an online trading system support like email, Skype, webinars and phone support.
If you can locate an online forex trading system with all of the components listed above, it would greatly reduce difficulties of any trader learning how to trade the forex market profitably. With a system like this you could set up a forex demo account with any broker you wish and begin demo trading almost immediately and working on profit taking techniques prior to going to live lots.
Forexearlywarning Has an Online Forex Trading System
If you are a forex trader looking for a complete online trading system, with all of the components listed above, there is one complete system available from Forexearlywarning. You can use the Forexearlywarning online trading system with any broker you like. We have trend based trading plans, several alert systems, and excellent live indicators like The Forex Heatmap® to validate all of your trade entries. Compare this online system with any one you see on the web and you will determine that this is the best online forex trading system available. The system works for 28 pairs and eight different currencies.
Posted in Uncategorized
What Is The Best Time Frame For Forex Traders To Use?
What is the best time frame for forex traders to use is a commonly asked question by traders. Most trading platforms have 9 time frames, like Metatrader. We will review the time frames and the role each time frame plays in the day to day movements, trading cycles, and the formation of long term trends.
The Role of The Time Frames
The time frames on a currency pair serve two functions, smaller time frames can be used for trade entries, and the larger time frames can be used for overall trend and market analysis. Lets get more specific here.

What Is The Best Time Frame For Forex Traders
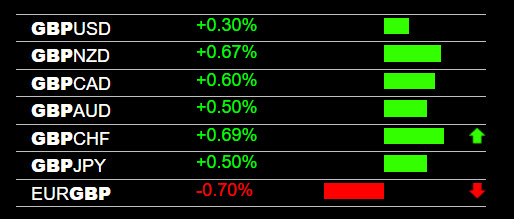
Time frames used for trade entries: M5, M15. Time frames use for overall market trend analysis: H4, D1, W1. The shorter time frames can be used for managing your trade entries along with our real time momentum indicator, The Forex Heatmap®.
The Forex Heatmap®
Smaller Time Frames
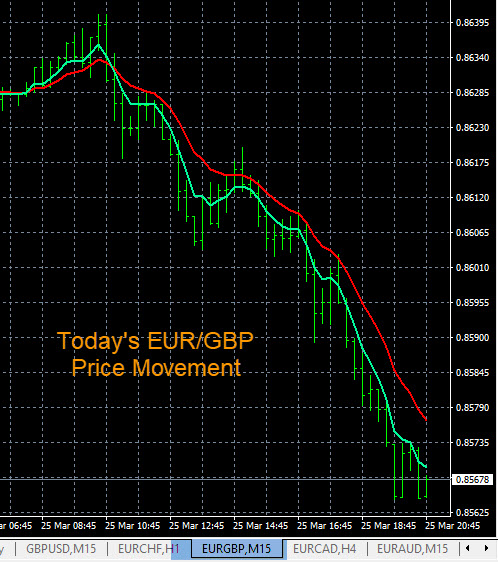
You can see the shorter time frame here M15 with the live heatmap signals. On this particular day the GBP was strong on all pairs and it drove the EUR/GBP downward. If the EUR/GBP is trending down on the larger time frames like the H4 or larger, you can enter the trade and hold on for more trend based pips to the next support level. The red and green lines on the chart are our free trend indicators, which are a system of exponential moving averages.
Uses For The H1 Time Frame
The H1 time frame is a hybrid and can be used to anchor daytrades or give a heads up on the H4 cycle starting. When you see movement on the smaller time frames and a strong heatmap signals, if the H1 time frame is starting a new cycle we consider this to be a great scenario for a trade. Especially a sharp reversal of direction. If a currency pair is going sideways for a couple of days or more and the H1 time frame breaks in one direction, this could lead to a new H4 or D1 trend forming. So either way the H1 has lots of utility to traders.
What Time Frames Do I Use For Market Analysis
To analyze the forex market you use all of the time frames, this is called multiple time frame analysis or “drilling down the charts”. Straightforward old school chart analysis. You start with the largest time frames and move down to the lower time frames looking for trends, oscillations and breakout points. We also have a great tool called the forex market analysis spreadsheet. This tool should be used on the larger time frames like the H4, D1 and W1 time frames. They you will know what currencies are strong or weak, and what pairs are trending at all times. Learning multiple time frame analysis will take time, but the rewards will be great.
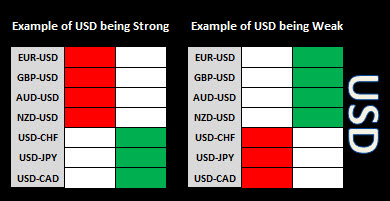
Forex Market Analysis Spreadsheet
This is what the spreadsheet look like for the USD pairs. You can analyse the USD, CAD, EUR, CHF, GBP, AUD, JPY and NZD pairs with this straight forward tool to determine market direction. It is an excellent tool for creating trading plans also.
Charting Platforms And The Time Frames
Most charting platforms like Metatrader or some of the web based charting systems offer the 9 basic time frames for the various forex pairs, and some offer custom time frames. As long as you can set up the trend indicators in the images above by individual currency and group them together on one screen, like the metatrader profiles, any charting platform will work with the techniques described in this article. Most of the time you can detect trending pairs, ranging pairs, support and resistance levels, or a choppy market by drilling down the charts daily using multiple time frame analysis.
Using The Same Time Frame On Multiple Pairs
If you set up your charts using the metatrader profiles, you can view 7 charts at a time on the small or large time frames. This type of chart setup is only used by less than 1% of forex traders but is by far the most powerful chart setup you can use. You can also navigate quickly 7 charts at a time using the hotkeys on your keyboard. Example, you can view all of the CHF pairs on one screen on any time frame, or the JPY pairs all on one screen for any time frame. This is a lifetime chart setup and you will use it as long as you trade the forex market.
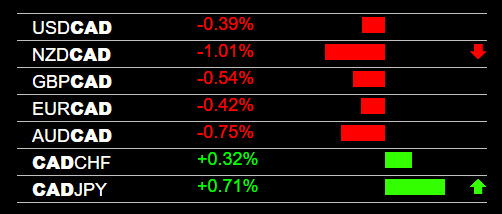
CAD Pairs Signals
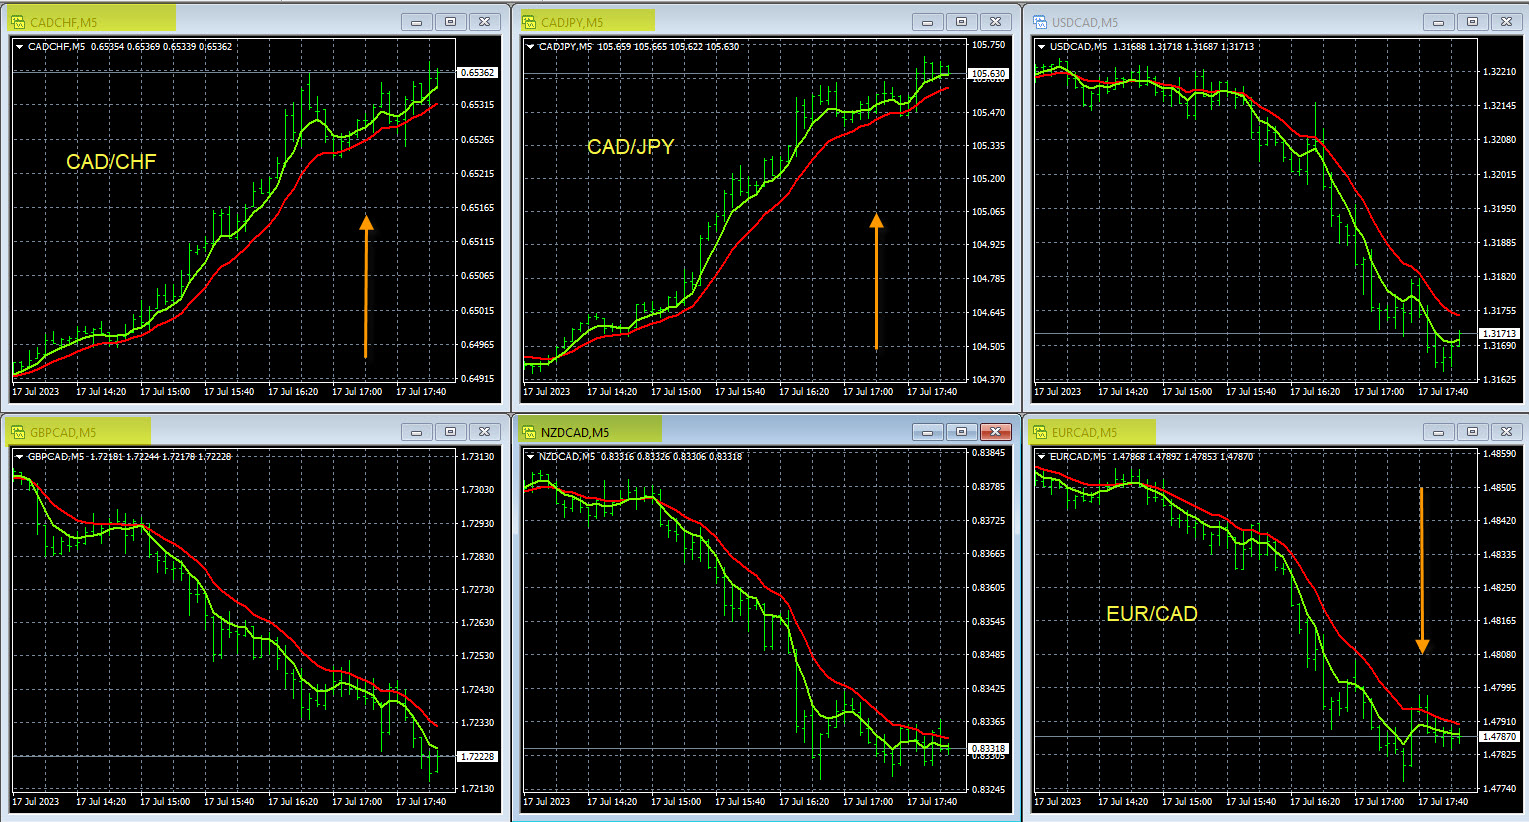
Same Time Frame On Multiple Pairs
Setting up your charts this way allows you to view any time frame on any group of pairs. So if you are a daytrader, swing trader or longer term trend traders this chart setup is suitable.
Daytraders use the smaller time frames like the M5 and M15 to monitor the intraday movements and to manage trade entries. If your trading style is swing trading, you can enter on the smaller time frames, then inspect the H4 time frame to see where you are in the overall H4 cycle.
Example Use Case For The Various Time Frames
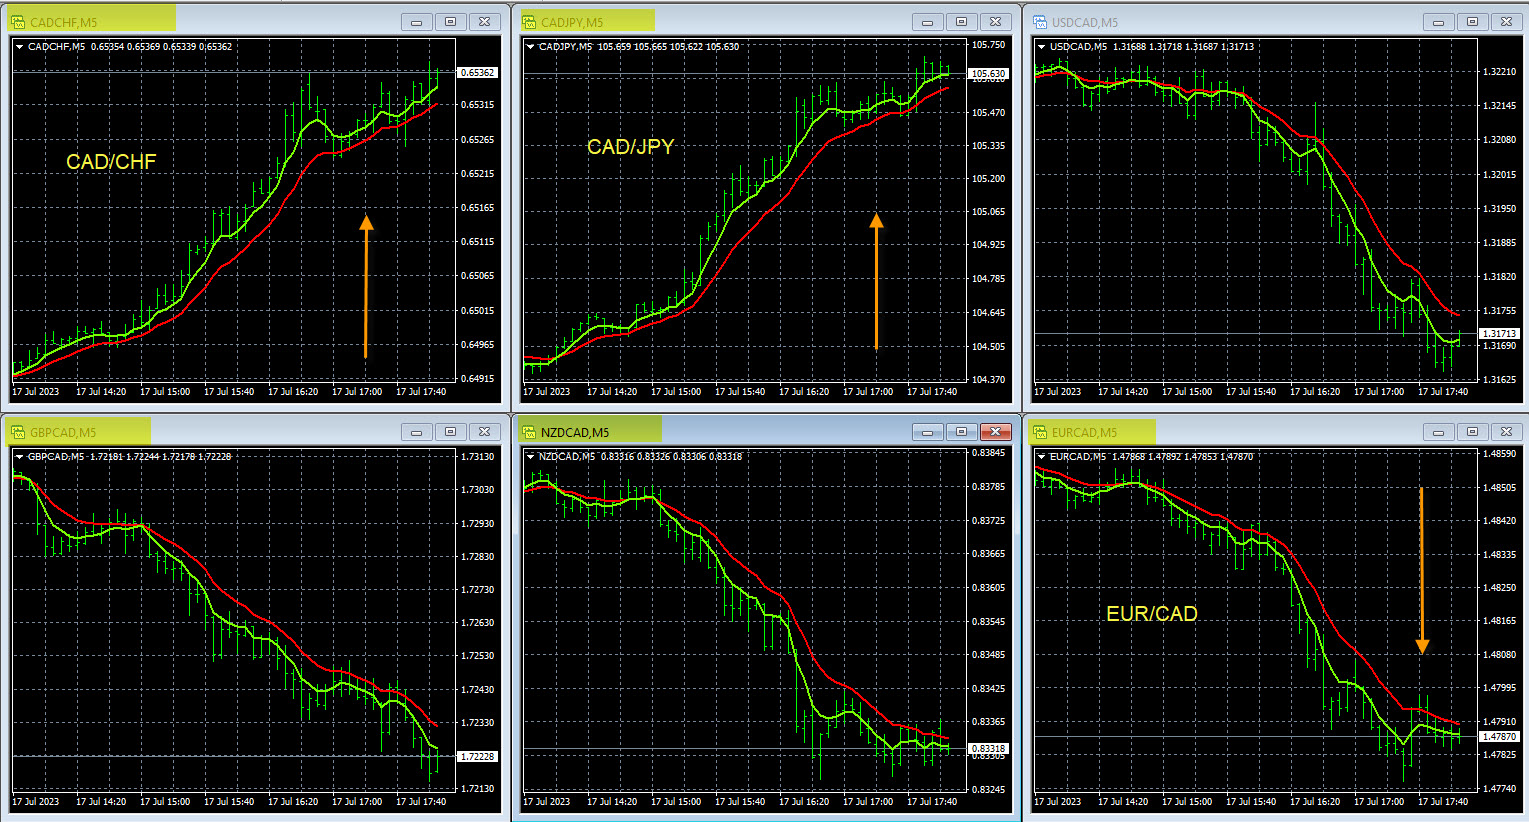
Please refrence the CAD signals and price movements above. A trader gets a notification that the CAD is strong. They pull up their charts and heatmap and decide to sell the NZD/CAD. In this case they use the heatmap signals and smaller time frames to enter the trade. When the pairs stalls they move their stop to breakeven and scale out half of their lots. Then they inspect the D1 time frame and the trend is down with no nearby support, they decide to hold the NZD/CAD sell position for more trend based pips. This is a good illustration of how to use the various time frames for their intended purpose. No random trade entries or hold decisions. If the NZD/CAD hits strong support is not trending down on the larger time frames, the trader should exit the trade.
Best Pairs To Trade
Now that you know the best time frames to use and how to set up your charts, now here is a list of the best pairs to trade. Any combination of the top 8 most liquid currencies is good for this charting and time frame system. The top 8, most liquid currencies are the USD, CAD, EUR, GBP, CHF, JPY, AUD and NZD pairs. There is a total of 28 pairs.
As is the case for any new trading system or charting system, we ask all traders to demo trade this system and to be responsible. However you will be impressed with the way you are able to see the pips and movement cycles. You will no longer be a prisoner to the horrible technical indicators that almost all forex traders use every day. You will see that the daily movements in the forex market are caused by the strength and weakness of the individual currencies in each pair. Your entire vision of the forex market will change.
Summary and Conclusions About Forex Time Frames:
Forex traders often ask questions like: What is the best Time Frame To Use?, the answer is most likely all of them. The higher time frames and lower time frames can both be utilized to improve your market analysis and trade entries, all time frames play a role. Combine this with professional alert systems and signal systems presented here into a winning trading system.
Posted in Uncategorized