Forex Heatmap® Tutorial, Real Time Trading Signals
Fundamental Basis For The Forex Heatmap
List of Forex Heatmap Features And Controls
There are two separate heatmaps, the one on the left is for the Asian trading session and the one on the right is for the main trading session. Here is a picture of the top portion of the heatmap "header" area.
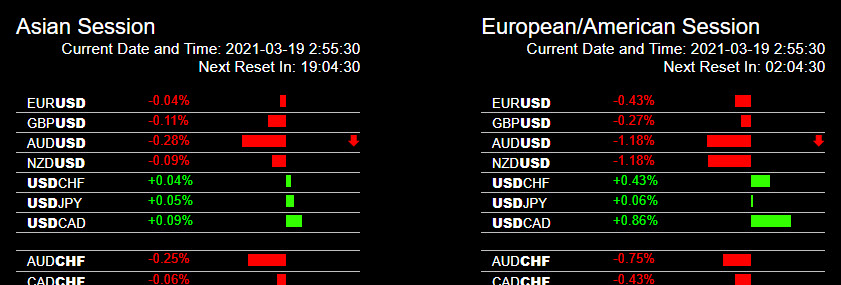
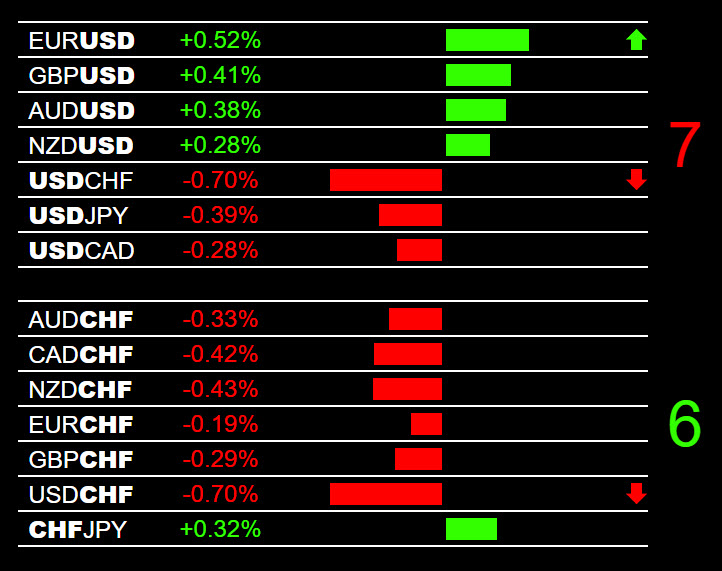
Clocks - Each of the two heatmap resets once per day. The Asian session heatmap resets to zero just ahead of the Sydney and Tokyo market trading sessions so you have a fresh set of readings for trading the AUD, NZD and possibly the JPY pairs. The clocks on top of each heatmap also tell you how much time there is before the next reset. The main session (London/Europe/USA Markets) heatmap resets to zero so you get a set of fresh readings for these markets. The current GMT time is listed at the top of each of the two heatmaps. The heatmap has 28 pairs and 56 slots, each currency pair is in two slots. For example the EUR/USD is in the EUR pairs group and also in the USD pairs group.
Zoom Feature - Most web browsers have a zoom feature. Since the heatmap is on a webpage you can zoom in and out to magnify the heatmap 10%, 25% etc. for better visibility, depending on the size of your computer or device screen. Just hit the CTRL and + or - buttons on your keyboard for this enhanced visibility and customization feature.
Arrow System - The heatmap also has an arrow system that points traders towards pairs that are moving the fastest. The purpose of the arrow system is to have an "eye catching" way to get traders to look for currencies with consistent strength or weakness that might give you a good trade entry point. If you look at the image at the top of this page with the USD pairs, you can see consistent USD weakness, so the arrows have pointed you in the right direction. Consistent signals produce much more consistent trades. The arrows do not appear unless at least one pair has 0.25% of movement. So if there are no arrows it means the market is going sideways with no movement and you can see this at a glance
Real Time, Hands Free - The heatmap is programmed so that the page refreshes every few seconds. This way you can set the heatmap up on one screen and watch the charts and execution system on another screen. This hands free operation makes it easier for traders to monitor trade entry points.
Backup Heatmap - The heatmap has a reduntant backup system, so you have access to two heatmaps. If one of our heatmap servers drops off you just click on the backup heatmap link on the dashboard for continuous trading and seamless market monitoring.
Browser/Mobile Display - The heatmap runs on most web browsers without a problem. If you cannot see the heatmaps, shut down and restart your computer and clean your cache memory. Check the heatmap on browsers like Chrome, Microsoft Edge, or Firefox. Also you can uninstall and reinstall your favorite browser to get the latest version, this could also clear up many minor heatmap display issues. The most popular web browsers have different types of settings and controls which allow screen re-sizing, magnifying, customization, etc. If you have an older operating system or browser with add-ons, plugins and extensions this could interfere with the visibility of the heatmap. The heatmap also displays well in almost all mobile devices. Email us with any questions. The Forexearlywarning website meets all google standards for site speed, security, and mobile usability/display.
Numbering System - Numbers 6 or 7 on the right of each currency point you directly to the strongest and weakest currencies in real time for much easier trading of the daily strong/weak market dynamic for finding the best trades. 0.20% or higher in the same direction is criteria.
What Drives The Forex Heatmap® - Price is the driver of the heatmap. Prices create the readings and visual look of the heatmap. Price is incredibly important in our trading system and is used on our moving averages, alert breakout points, pair quotes, heatmap and trade entry points. Price is and always will be the best information to use for any forex trading system or high quality indicators.
Using The Forex Heatmap For Your Trade Entries
We recommend using the heatmap to verify all trade entries. The best situation will always be a trending pair or asset on the larger time frames with no resistance nearby, or no nearby support for sells. Use the higher time frames. If a pair or asset is trading in a range just make sure the range is wide and dont compromise risk reward ratio. When the charts are choppy consider only much smaller trade sizes or dont trade at all. Set your price targets using the higher time frames. After news wait for the market to settle down for a while then see if a trade is available. We have written procedures on our website for almost all situations.