Forex traders can use British Pound GBP news drivers on the economic calendar to locate strong price movements. Traders can capture these movements and profit from them with the techniques we will demonstrate. This article will show any trader how to track these volatile GBP (British Pound) pairs and we will also show you a great indicator set for trading these pairs.
Locating British Pound GBP Economic News
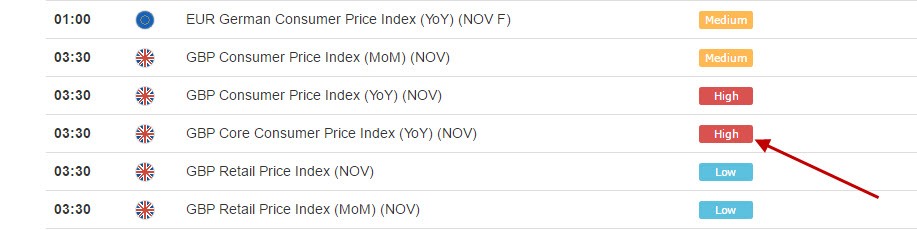
Forex traders should become familiar with the world economic news calendar. The calendar can be customized to show British Pound GBP news events or news events for any other currency they like. Some examples of scheduled GBP news announcements that create volatility in the GBP pairs are: Consumer Price Index, Core Consumer Price Index, Bank Of England Interest Rate Decisions, BOE Asset Purchase Target, Manufacturing PMI, and many others. These economic news drivers are scheduled and traders can watch the market after these news announcements for trading opportunities to buy or sell the GBP pairs.
GBP News Volatility
If you need a world economic news calendar to track GBP news events we have one on our website. These handy calendars will also provide you with scheduled news drivers for other important and most actively traded currencies. Now that you know how to look for scheduled GBP news, and what time these economic news announcements will be. The next thing you need to do is determine how to enter trades on the GBP pairs when they move up or down after the news.
British Pound GBP Pairs And Volatility
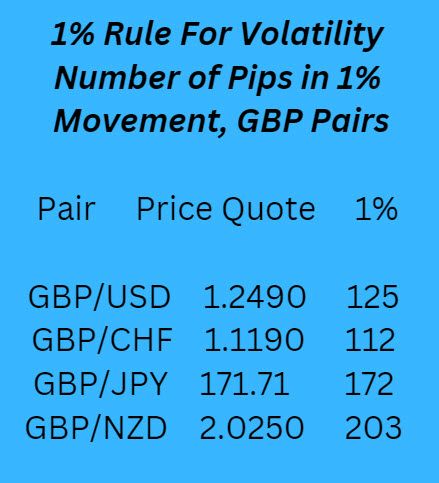
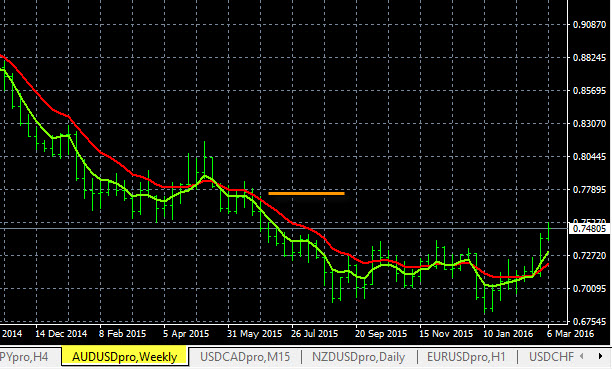
We trade 28 pairs at Forexearlywarning, and 7 out of the 28 pairs are GBP pairs. These pairs are all quite volatile. The EUR/GBP is the low volatility pair in the group, and the GBP/NZD is hyper volatile. If all 7 GBP pairs moved 1% in one day, the total movement on all 7 GBP pairs would be around 1000 pips on the day this article was written, and it used to be much higher before the Brexit vote. Some forex traders almost cannot believe it, but this type of volatility makes the GBP pairs group the most volatile group of most commonly traded pairs. The opportunity is here to make a lot of pips and the volatility makes it possible. Based on some recent price quotes you can calculate the natural volatiliity of any GBP pair.

GBP Pairs Natural Volatility
Example British Pound GBP News Trade and Signal System
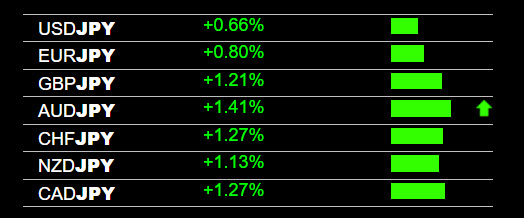
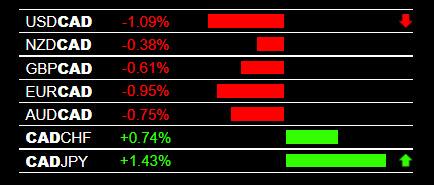
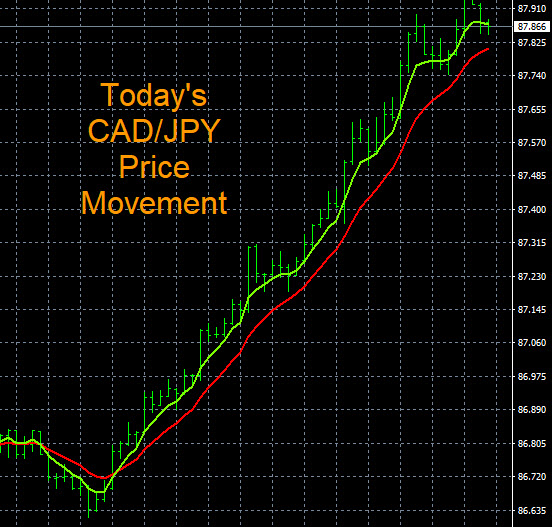
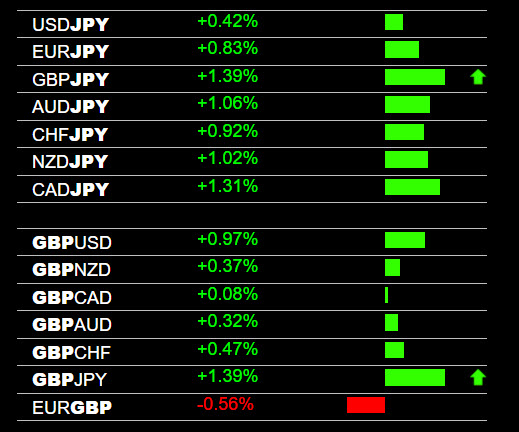
On April 4, 2016, the British Pound GBP had a scheduled news driver on the economic calendar, it was the GBP Manufacturing PMI news announcement. The net result for traders was that the GBP weakness dominated most of the market movement after the news announcement. The GBP was weak on all pairs on this day and pairs like the GBP/JPY, GBP/CHF and GBP/AUD all sold off hard. The trading signal you see below is from The Forex Heatmap®, which provides live buy and sell signals for the GBP pairs and 7 other currencies. It provides live trading signals during forex market hours and after all forex news drivers across 28 pairs. As you can see the GBP was weak on this day after the GBP news announcements and this drove strong price movement.
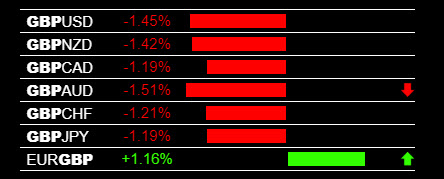
GBP News Volatility Signals
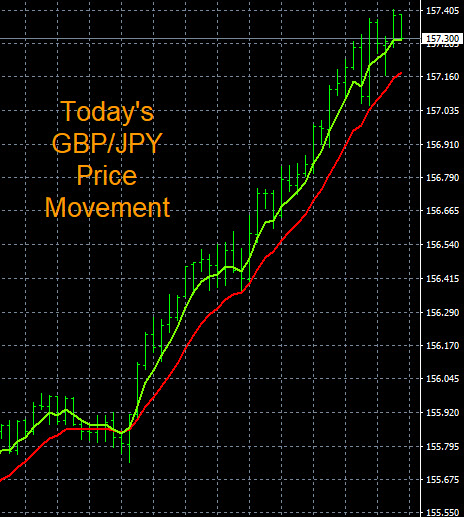
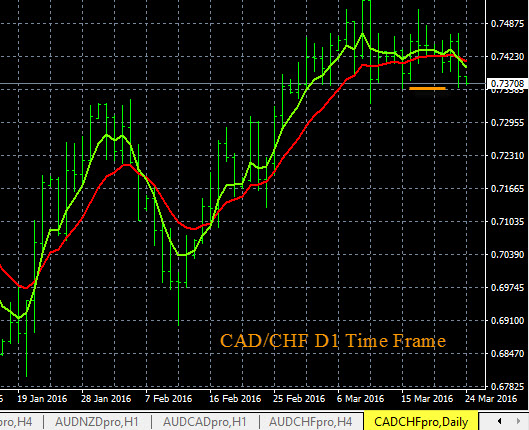
Also, an example chart of the GBP/CHF sell off is also shown, you can see this pair alone sold off 175 pips. The GBP pairs as a whole moved much more than 1000 pips in one trading session on this day.
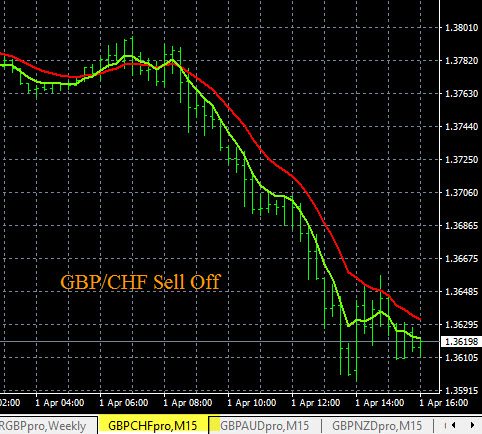
GBP News Volatility GBP/CHF
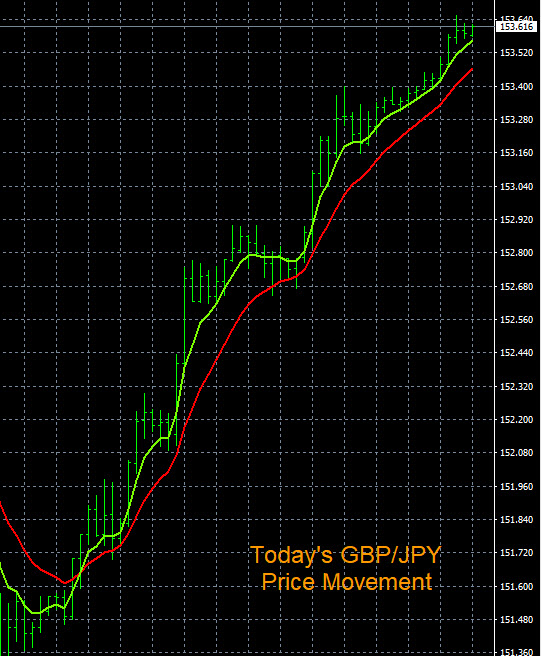
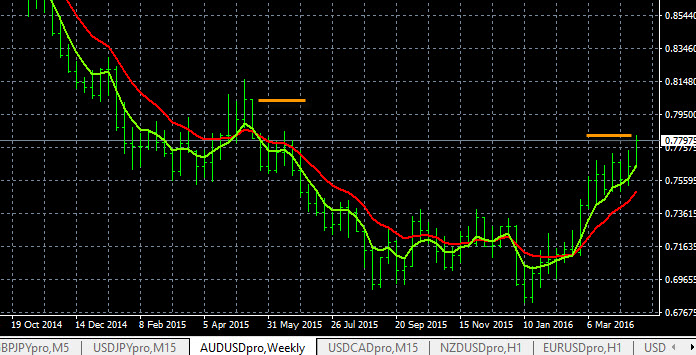
If you combine the trend, GBP news economic drivers, and The Forex Heatmap ® forex heatmap, you can start to build a powerful trading system. On this day the GBP/JPY was in a long term downtrend and it also dropped on the GBP weakness. We estimated on his day that the GBP/JPY should continue down to at least the 158.50 support level on the H4 time frame, or possibly much lower. The GBP/AUD broke out to the downside and this pair resumed the downtrend on the W1 time frame, with the next major support is at 1.8350, so additional pip potential is available on the GBP pairs. The live heatmap signals will give you a profitable trade entry, but if you are trading with the major trends and breakouts you can start riding the trends lower on these pairs and add to your pip totals.
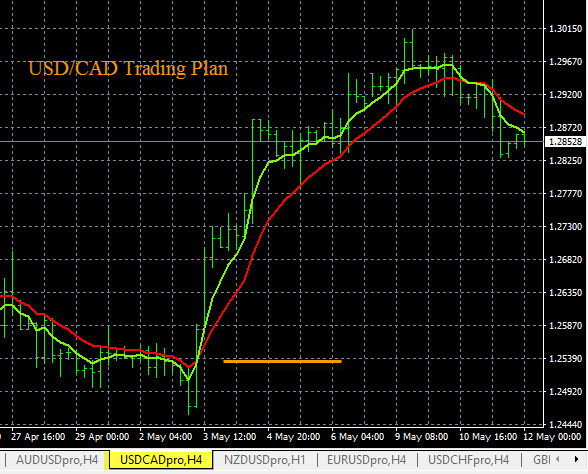
All 7 GBP Pairs On One Screen
The best chart setup for the GBP pairs would be to see all 7 GBP pairs on one screen. This is possible with the metatrader profiles chart setup. Look at the heatmap image above, you can set up your charts to match the heatmap with all 7 GBP pairs on one screen. Traders can set up all 8 currencies we track the same way for consistent, logical forex trading.
More Volatility and Strong Price Movement
The GBP pairs are naturally more volatile, but less volatile pairs can become much more volatile after scheduled news divers, or other unexpected worldwide news events. Pairs that are less volatile become much more volatile after news events, as long as one currency is consistently strong and the other currency in the pair is consistently weak. We track 8 currencies including the GBP pairs with our indicators. Following all 28 pairs and 8 currencies is fairly easy, and when combined with our professional forex alert systems and the economic calendar, you will always be in the know when currencies are moving.
Here is our video study guide for GBP Pairs Volatility on Youtube.