
- Categories
-
Recent Posts
- Crypto Currency Heatmap For Trade Entry Management
- High Confidence Gold Trading System
- Fine Tuning Your Forex Trade Entries
- GBP/CHF, EUR/GBP Example Trade Entry
- Live Trading Capital: Funded Forex Account, Forex Funding
- Forex Mobile App On Telegram
- Forex Scanner, Real Time Screening Signals For 8 Currencies
- Forex Audio Book, MP3 Library
- Forex Trading Seminar — Can I Become A Forex Trader?
- Why Strength/Weakness Works Best For Forex Trading
Category Archives: Uncategorized
Currency Strength Strategy For 8 Currencies, Three Methods
In this article we will present a currency strength strategy for currency trade entries, chart setup, and another strategy for overall market analysis. All three strategies are effective at helping currency traders to understand what currencies and pairs are strong or weak and are moving with good momentum. These strategies will also improve any trader’s understanding of the current market condition. The strategies work very well for the 8 most liquid currencies and 28 pairs total.
Currency Strength Strategy For Current Market Momentum
If you are a currency day trader or you just want better entry points into the trends of the market, knowing where the curent momentum in the market is right now is a must. Measuring the current market momentum in real time is one currency strength strategy that can be applied to all trade entries.
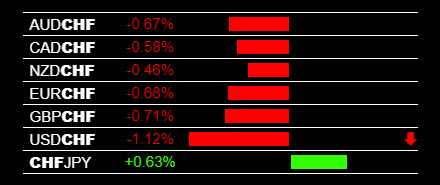
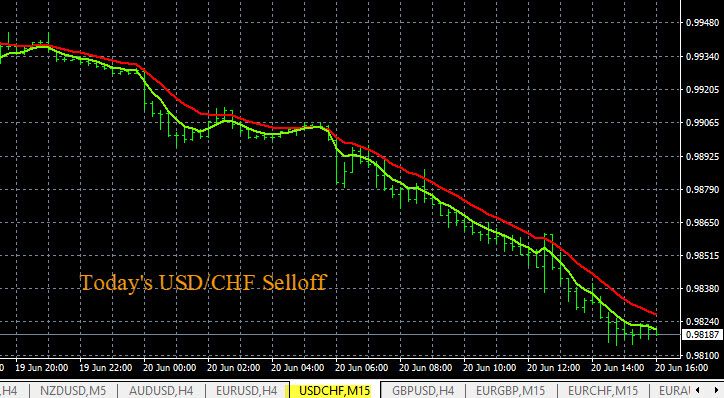
In the example below the Swiss Franc CHF is strong on all pairs in real time. This drove significant movement for traders on this day in the main trading session. These are seven of the CHF pairs we follow with the Forexearlywarning trading system. There was also some minor US Dollar USD weakness in the market. So the USD/CHF moved strong to the downside, and it makes perfect sense. So you have a strong entry point and additional potential for more pips riding the D1 time frame down trend on this pair.
Currency Strength Strategy
Currency Strength Strategy Chart
Also, the GBP/CHF dropped on the CHF strength and is currently at one support level, so in this case a trader may choose to scale out lots and reduce position size. So you can also plan more trade entries going forward on the pairs that are trending.
A phenomenal and profitable day of trading for any day trader or trend trader on only one group of pairs, with strong intraday movements. The real time currency strength indicator in this strategy is The Forex Heatmap®, which is our accurate currency strength meter that provides live buy and sell signals for 28 pairs, including the US Dollar USD pairs and seven other currencies. The heatmap is showing that the USD/CHF moved 1.12% on this day, which is around 105 pips of movement on just one pair in one trading session.
Another Example of Intraday Currency Strength
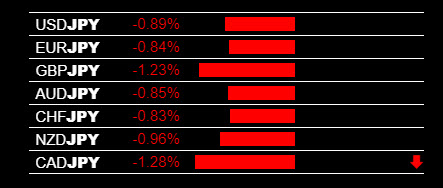
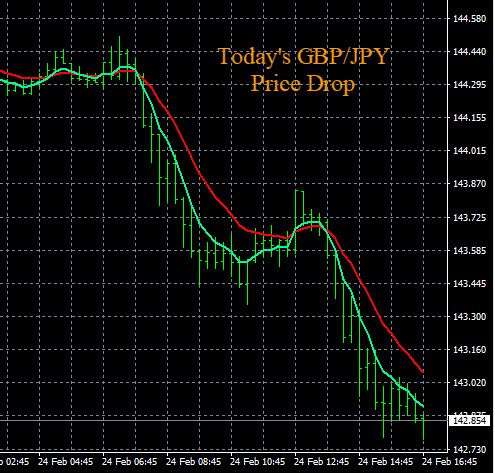
This is another example of how to use intra day currency strength for strong trade entries. Look at the example below. On this day the British Pound GBP was slightly weak, but the Japanese Yen JPY strenght dominated this currency. This caused a strong sell off on the GBP/JPY. This pair sold off over 150 pips in one both tradingsessions combines over a 15 hour period.
Also, the major trend on this pair is down on the larger time frames, so more pips are possible as this pair continues lower on the major trend. Trading with the trend and using strong entry points is the best way for forex traders to profit from market movements.
Currency Strength Strategy JPY
Currency Strength Strategy GBP/JPY
Strong signals like this happen routinely on the forex market if you incorporate these tools into your trading. We track 8 currencies at Forexearlywarning, but since so many traders use technical indicators on 1 or 2 pairs, they always miss the movements on pairs like the GBP/JPY pips, even though this is a great pair for trading. Using easy to interpret visual tools like The Forex Heatmap®, which monitor the strength of the currencies and money flows in real time, you can trade like a pro. Incorprating the heatmap into your currency strength strategy for trading is a must.
Currency Strength Chart Setup
Traders can supercharge their trading with the proper chart setup. We have a powerful chart setup for currency traders that matches our individual currency strength approach. Look at how the chart setup on the USD pairs matches the live heatmap indicator. This is a powerful way to see the pips every day.
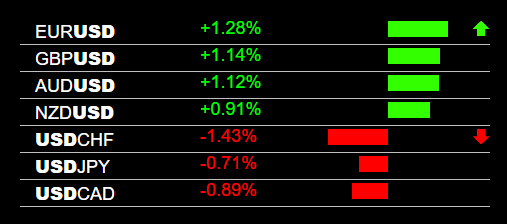
Currency Strength Strategy Heatmap
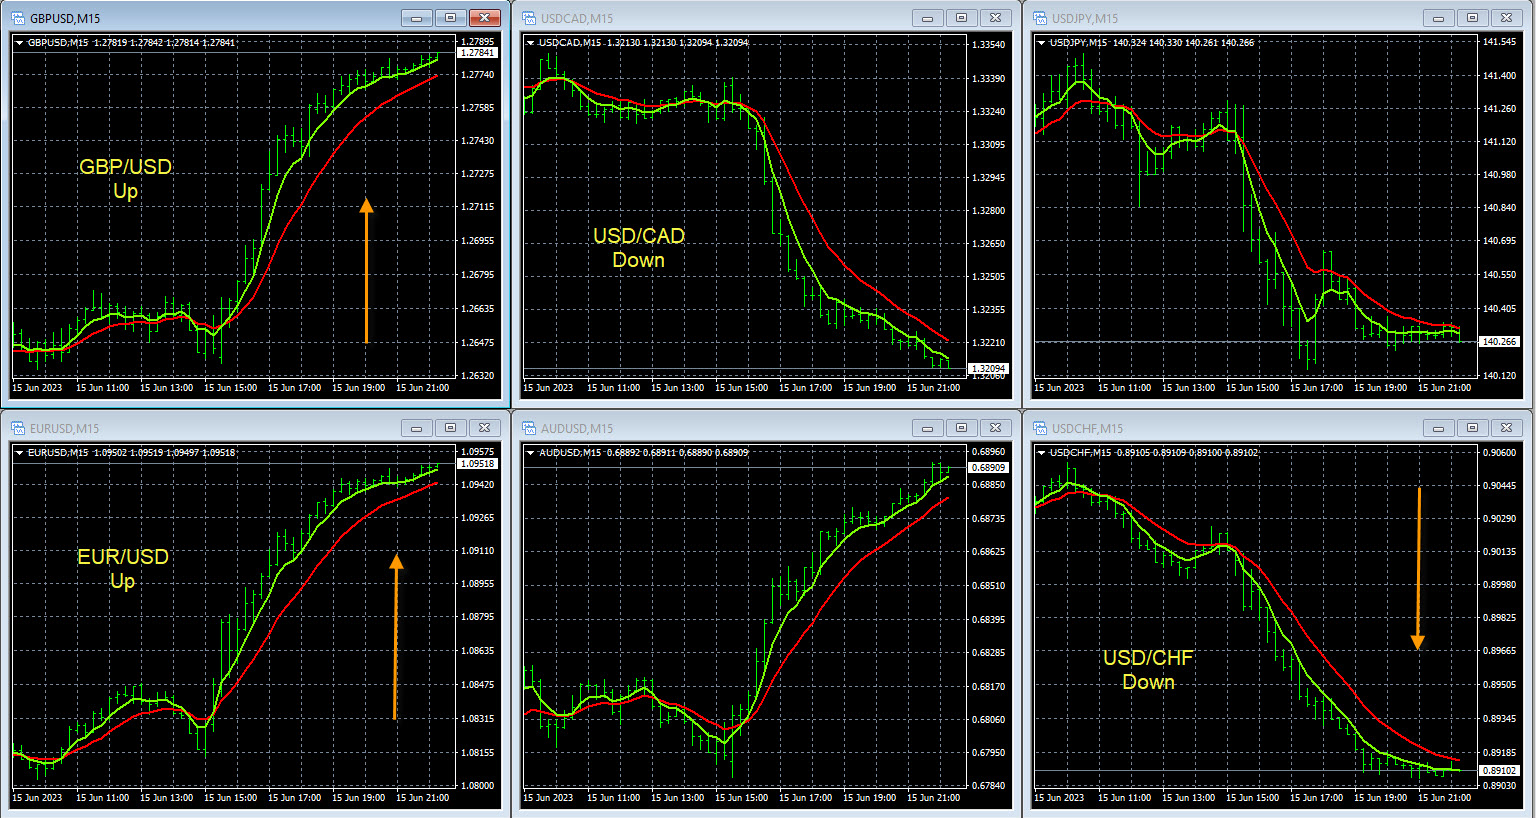
Currency Strength Strategy Chart Setup
CLICK ON IMAGE TO SEE FULL SCREEN
Your trade entries will improve dramatically with a chart setup like this and you can learn how to set this up using the metatrader profiles. This chart setup works for 8 currencies and 28 pairs to see the currency strength very clearly.
Using Currency Strength for Overall Market Analysis
Another great currency strength strategy for 8 currencies is to analyze individual currencies as they appear with market trends. Currency traders who like our real time currency strength tools can also have a big advantage if they use a currency strength strategy for total market analysis every day. Always knowing the overall condition of the market, based on trends will raise the bar even higher and complete your overall currency strength trading system. Analyzing the market time frames to determine the strongest versus weakest currency takes time but it well worth it, and your reward will be to capture more pips.
You can set up some simple exponential moving averages for all of the JPY pairs, USD pairs, NZD pairs, etc. to start. Then drill down the charts daily using multiple time frame analysis by individual currency. For example if all of the JPY pairs are in up trends, then you know the JPY is weak. Then, if you analyze the AUD pairs and the AUD looks strong, you know to check the AUD/JPY for a potential strong movement or trade entry. You can then monitor this pair with price alerts. Use similar procedures for the 8 currencies and 28 pairs in our trading system.
On the Forexearlywarning website, we show you how to set up the trend indicators, and how to analyze the market by individual currency. We have a great tool for market analysis, it is our forex market analysis spreadsheet. After you fill out the spreadsheet you will know where all of the market momentum is, based on the trends of the market and individual currency analysis on the higher time frames. This way you will not only be trading in the direction of the daily market momentum, but also with the trend.
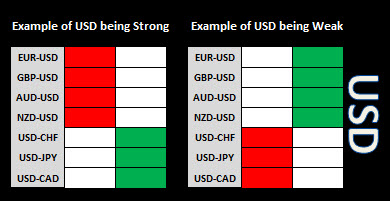
Currency Strength Spreadsheet USD
In this example all of the trends on the H4, D1 or W1 time frame are pointed in the direction of USD weakness. The forex market analysis spreadsheet can be filled out daily for 8 currencies and 28 pairs. It can be helpful for planning trades in the direction of the major trends.
In this article we have presented three valid currency strength strategy methods. We urge all forex traders to use these strategies every day and their positive trades and pip totals will improve dramatically, while incorporating up to 28 pairs into their trading program.
Posted in Uncategorized
Currency Trading Signals CAD Strength
Today in forex trading the CAD (Canadian Dollar) was strong, dviving lots of price movement for traders. These currency trading signals indicate that the CAD was strong and consistent.
The CAD strength drove substantial movement on several CAD pairs for traders. The live trading signals from The Forex Heatmap® are shown below. The CAD/JPY moved much higher, and this pair still has more upside with trend support from the H4 time frame, but the larger trends are still pointing down, so we would scale out lots and manage profit on any buy trades up to the next major resistance on the H4 time frame. These CAD/CHF should continue higher at least one more day.
The USD/CAD also sold off, this pair also has H4 trend support, but the overall longer term trend is up, so once again scale out lots and manage the trade as it continues lower. The trading signals from The Forex Heatmap® are shown below, this signal system provides live signals for 28 currency pairs. It is a powerful live trade entry management tool based on forex analysis with parallel and inverse pairs and individual currency strength.
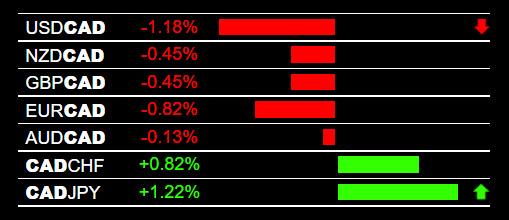
Currency Trading Signals CAD Strength
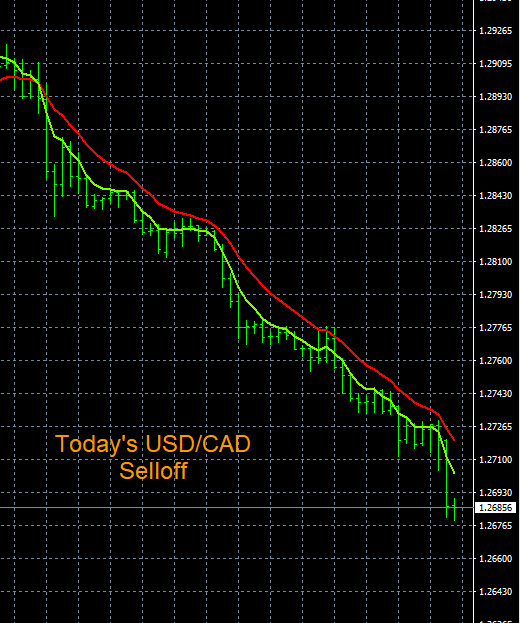
Currency Trading Signals USD/CAD Chart
Posted in Uncategorized
EUR/GBP Trend Analysis
This is our trend analysis of the EUR/GBP. This currency pair is trending higher on the larger time frames, like the W1 time frame shown below. The current resistance point is at 0.7570. Traders should set an audible price alert here. When the alert hits check The Forex Heatmap® to verify any buy trades. The current upside potential looks to be the 0.7900 resistance area, which is 230 pips of potential. Using the higher time frames breakouts will always give you trades with much higher pip potential and money management ratio.
The EUR/GBP trend analysis was done using multiple time frame analysis of trends by individual currency, which is the most thorough method of currency pair analysis available to forex traders. The indicators we use are 5/12 exponential moving averages.
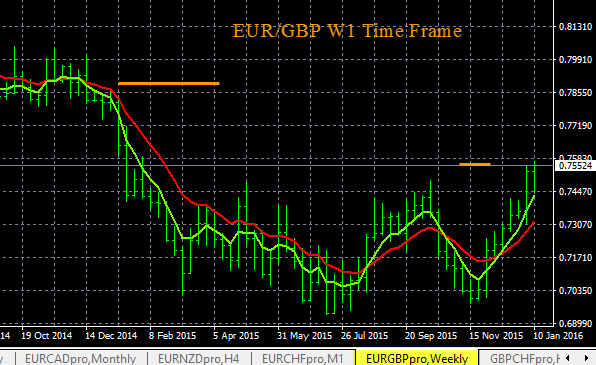
EUR/GBP Trend Analysis
Posted in Uncategorized
GBP/USD Currency Strength Trading Signals
See the GBP/USD currency strength trading signals below. These are live trading signals. The British Pound GBP was weak on all pairs so the GBP/USD sold off. This occured after the manufacturing production output news in the main forex trading session. The USD also had some strength, so the GBP/USD sold off. This pair is in a strong down trend, however we are not able to tell exactly where the next major support level is on this pair so we would scale out some lots on any sell trades, and move your stop to break even on the remaining lots.
The trend is strong enough for this pair to continue much lower. The currency strength meter you see below is The Forex Heatmap®, which provides live trading signals for 28 currency pairs. It works well after economic news drivers to show you what pair to trade, we use this indicator to assist with trade entries on 8 different currency groups and 28 pairs including the including the British Pound GBP pairs. As you can see other GBP pairs made strong moves today.
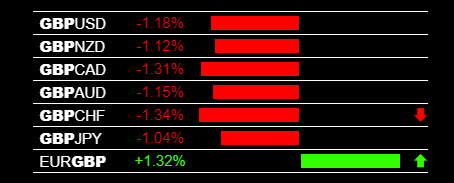
GBP/USD Currency Strength Trading Signals
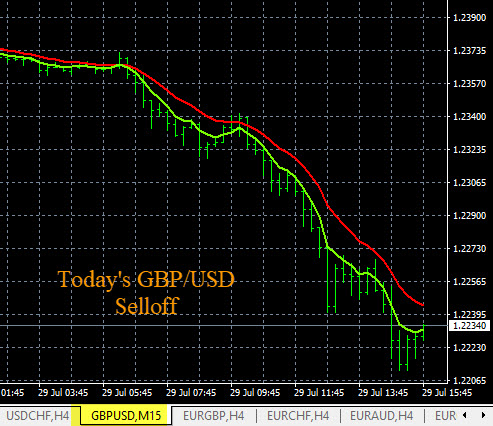
GBP/USD Currency Strength Trading Chart
Posted in Uncategorized
EUR/JPY Trend Analysis
Here is a trend analysis of the EUR/JPY on the larger time frames. The EUR/JPY chart below shows that this pair is trending down on the MN time frame. Current support level is at 126.00, the yellow line. Traders should set an audible price alert at this price for a sell. Below here you can check The Forex Heatmap® for EUR weakness or JPY strength or both to verify the sell. Below 126.00 this pair has substantial potential down to 100.00 to 109.00 support cluster. This is a very good chart setup for a long term trade.
Most or all of the JPY pairs are also in long term down trends right now, indicating across the board Japanese Yen JPY strength. This analysis of the EUR/JPY was done with multiple time frame analysis by individual currency, attached to a set of meta trader charts. These are 5/12 exponential moving averages.
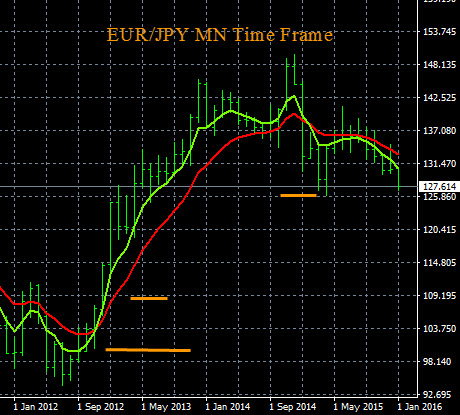
EUR/JPY Trend Analysis
Posted in Uncategorized
AUD/NZD Trend Analysis
This is our current AUD/NZD trend analysis. This pair looks like it is oscilating and ranging on the on the D1 time frame. Traders can set an audible price alert at 1.0675. When the price alert hits check The Forex Heatmap® to confirm any buy entries. On any buy entries you would be looking for consistent AUD strength or NZD weakness on the heatmap. This pair has great upside potential to the 1.1000 resistance area, over 200 pips of potential in the full D1 cycle.
This trend analysis if the AUD/NZD was performed with multiple time frame analysis by individual currency, which is our market analytical method for all 28 pairs we follow. When pairs are not trending some times they are oscillating, or ranging. This ranging currency pair is building an increasing bottom or higher support level than the previous lows, which is bullish. If traders want to learn more about forex chart patterns , we have resources and illustrated forex articles on our website.
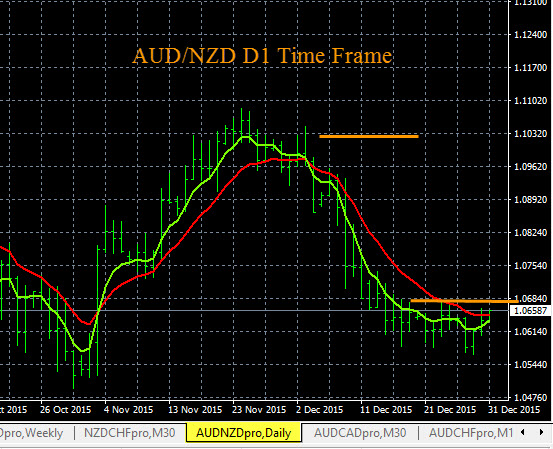
AUD/NZD Trend Analysis
Posted in Uncategorized
AUD Currency Strength, How Forex Traders Benefit
Forex traders can benefit from Australian Dollar AUD currency strength and make more pips. This was evident today on all pairs in the group, driving price movement. The GBP/AUD and EUR/AUD sold off, and the AUD/CHF rose strongly. The GBP/AUD is trending down on the larger time frames and should continue lower. The EUR/AUD is starting to trend down on the D1 time frame, and has additional potential on this time frame. So traders can continue to hold these pairs as they continue in their trends.
We will look to prepare another trading plan for selling these two pairs going forward. The currency strength signals you see below for today’s trading are from The Forex Heatmap® forex heatmap, which provides currency strength signals for 8 groups of currency pairs, including the AUD pairs and a total of 28 currency pairs. When you see consistent signals on the heatmap, a large number of pips is possible for traders in just one day of trading.
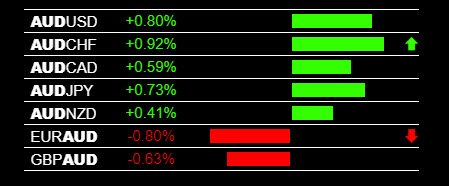
AUD Currency Strength
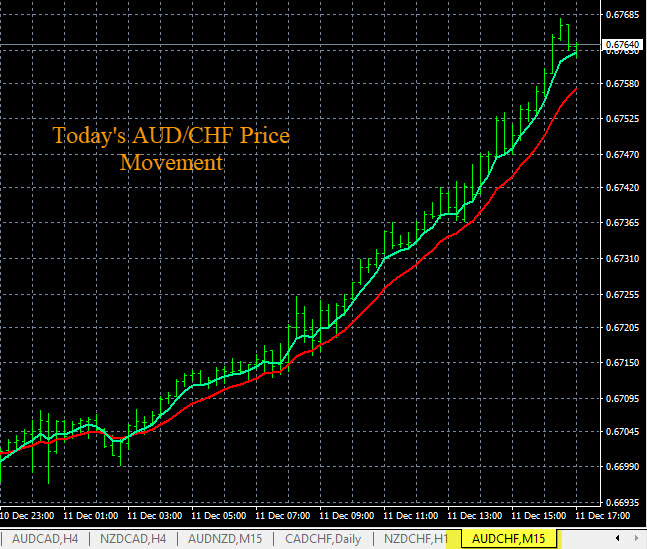
AUD Currency Strength Chart
Posted in Uncategorized
GBP/JPY Trading Signals
GBP/JPY trading signals can make forex traders lots of pips on this volatile pair. Look at the example GBP/JPY trading signals below on the live indicator called The Forex Heatmap®. On this day in forex trading, the British Pound GBP was strong and and drove a lot of price movement for traders. The Japanese Yen JPY was also weak. This combination drove substantial price movement on the GBP/JPY in one trading session.
A clear and obvious buy signal on the GBP/JPY appeared on The Forex Heatmap® forex heatmap, and this pair moved up 300 pips in one trading session. This is what traders need and are looking for, strong movements and volatility. The GBP/JPY is inside some resistance levels on the higher time frames, but with signals this strong the pair moved right through the levels and broke out on the D1 time frame. Traders can scale out lots on any buy positions and start riding the D1 uptrend.
The live trading signal system you see below is The Forex Heatmap®, our live entry management system for 28 pairs, including all 14 GBP and JPY pairs shown below in the images. The second image is our free trend indicators, a system of exponential moving averages that we analyze daily across individual currencies with our forex market analysis spreadsheet.
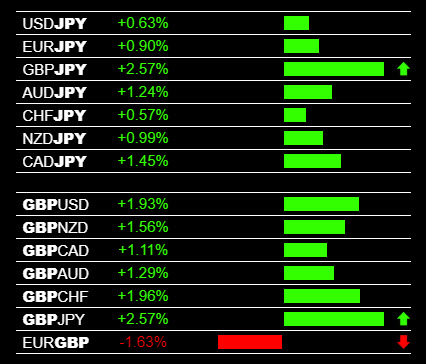
GBP/JPY Trading Signals
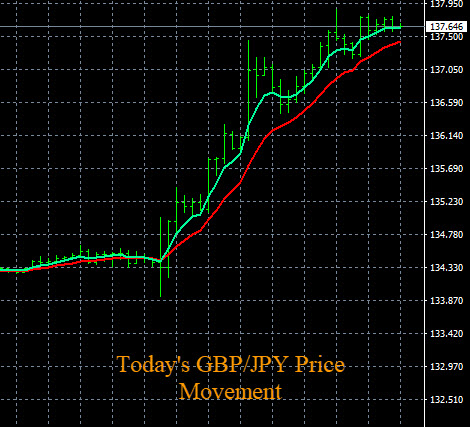
GBP/JPY Trading Signals – Price Movement
Posted in Uncategorized
Trading Canadian Dollar CAD Weakness
This is a great system for trading Canadian Dollar CAD weakness. On this day in the forex market the Canadian Dollar CAD was weak across the board, driving movement and trading opportunities on all pairs in the group.
The GBP/CAD rose and this pair is in a strong uptrend, it should continue much higher. The CAD/JPY also dropped, this pair has almost broken the 87.80 support area to the downside, with plenty of pip potential below there. This is about 100 pips of movement on the CAD/JPY, and a substantial amount of pips trading all 7 pairs. This is what traders want and need, a proven forex trading system that produces pips.
Since these pairs are trending based on CAD weakness, additional upside potential is available. We will look to continue to plan more trades on these pairs in the direction of their trends. The live trading signals you see below are from The Forex Heatmap®, which provides live signals for 28 pairs, including the Canadian Dollar pairs and 7 other currencies.
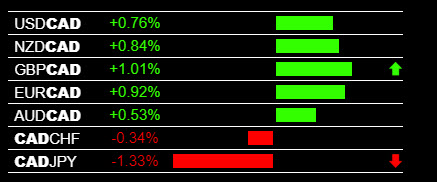
Trading Canadian Dollar CAD Weakness
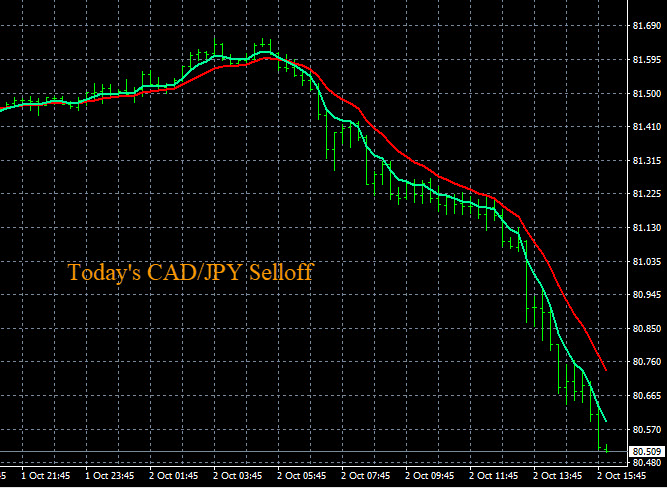
Trading Canadian Dollar CAD Weakness
Posted in Uncategorized
USD/CHF Trend Analysis
See the chart below for the USD/CHF trend analysis on the D1 time frame. The USD/CHF is close to starting a new uptrend in the D1 time frame.
Traders can set an audbile price alert at 0.9950, as indicated by the red line. Above that price check The Forex Heatmap® to verify any buy trade entries with consistent USD currency strength, CHF weakness, or both. The overall trend on this pair is up on the larger time frames, and we expect it to go back up to at least the 1.0300 area resistance area indicated by the top red line on the chart. So this is 350 pips of overall potential, which is excellent risk to reward ratio.
This chart is a set of two exponential moving averages, and they can be applied to the USD/CHF and all 28 pairs we follow with the Forexearlywarning trading system. Then you can conduct a trend analysis across all 9 meta trader time frames with multiple time frame analysis.
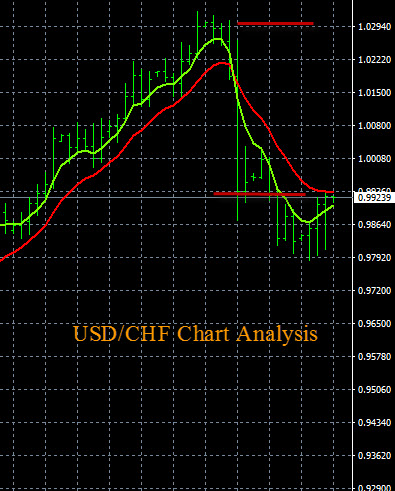
USD/CHF Trend Analysis
Posted in Uncategorized