What is the best time frame for forex traders to use is a commonly asked question by traders. Most trading platforms have 9 time frames, like Metatrader. We will review the time frames and the role each time frame plays in the day to day movements, trading cycles, and the formation of long term trends.
The Role of The Time Frames
The time frames on a currency pair serve two functions, smaller time frames can be used for trade entries, and the larger time frames can be used for overall trend and market analysis. Lets get more specific here.
What Is The Best Time Frame For Forex Traders
Time frames used for trade entries: M5, M15. Time frames use for overall market trend analysis: H4, D1, W1. The shorter time frames can be used for managing your trade entries along with our real time momentum indicator, The Forex Heatmap®.
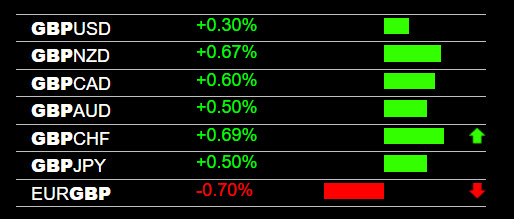
The Forex Heatmap®
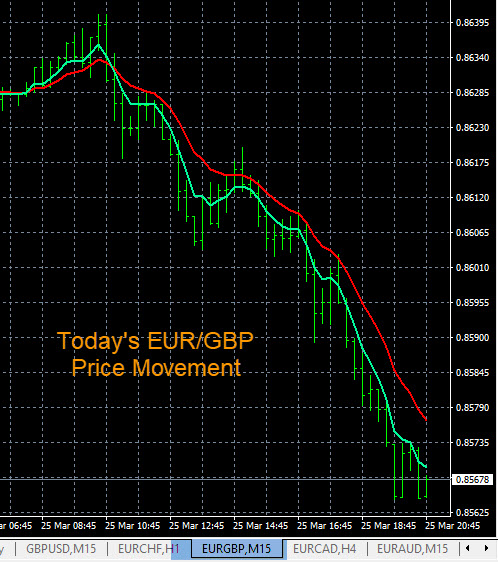
Smaller Time Frames
You can see the shorter time frame here M15 with the live heatmap signals. On this particular day the GBP was strong on all pairs and it drove the EUR/GBP downward. If the EUR/GBP is trending down on the larger time frames like the H4 or larger, you can enter the trade and hold on for more trend based pips to the next support level. The red and green lines on the chart are our free trend indicators, which are a system of exponential moving averages.
Uses For The H1 Time Frame
The H1 time frame is a hybrid and can be used to anchor daytrades or give a heads up on the H4 cycle starting. When you see movement on the smaller time frames and a strong heatmap signals, if the H1 time frame is starting a new cycle we consider this to be a great scenario for a trade. Especially a sharp reversal of direction. If a currency pair is going sideways for a couple of days or more and the H1 time frame breaks in one direction, this could lead to a new H4 or D1 trend forming. So either way the H1 has lots of utility to traders.
What Time Frames Do I Use For Market Analysis
To analyze the forex market you use all of the time frames, this is called multiple time frame analysis or “drilling down the charts”. Straightforward old school chart analysis. You start with the largest time frames and move down to the lower time frames looking for trends, oscillations and breakout points. We also have a great tool called the forex market analysis spreadsheet. This tool should be used on the larger time frames like the H4, D1 and W1 time frames. They you will know what currencies are strong or weak, and what pairs are trending at all times. Learning multiple time frame analysis will take time, but the rewards will be great.
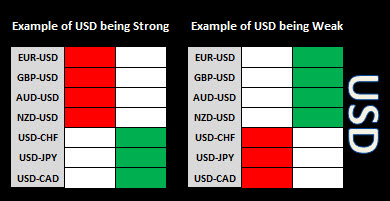
Forex Market Analysis Spreadsheet
This is what the spreadsheet look like for the USD pairs. You can analyse the USD, CAD, EUR, CHF, GBP, AUD, JPY and NZD pairs with this straight forward tool to determine market direction. It is an excellent tool for creating trading plans also.
Charting Platforms And The Time Frames
Most charting platforms like Metatrader or some of the web based charting systems offer the 9 basic time frames for the various forex pairs, and some offer custom time frames. As long as you can set up the trend indicators in the images above by individual currency and group them together on one screen, like the metatrader profiles, any charting platform will work with the techniques described in this article. Most of the time you can detect trending pairs, ranging pairs, support and resistance levels, or a choppy market by drilling down the charts daily using multiple time frame analysis.
Using The Same Time Frame On Multiple Pairs
If you set up your charts using the metatrader profiles, you can view 7 charts at a time on the small or large time frames. This type of chart setup is only used by less than 1% of forex traders but is by far the most powerful chart setup you can use. You can also navigate quickly 7 charts at a time using the hotkeys on your keyboard. Example, you can view all of the CHF pairs on one screen on any time frame, or the JPY pairs all on one screen for any time frame. This is a lifetime chart setup and you will use it as long as you trade the forex market.
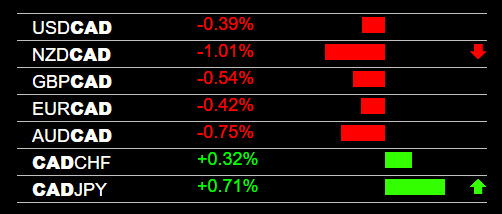
CAD Pairs Signals
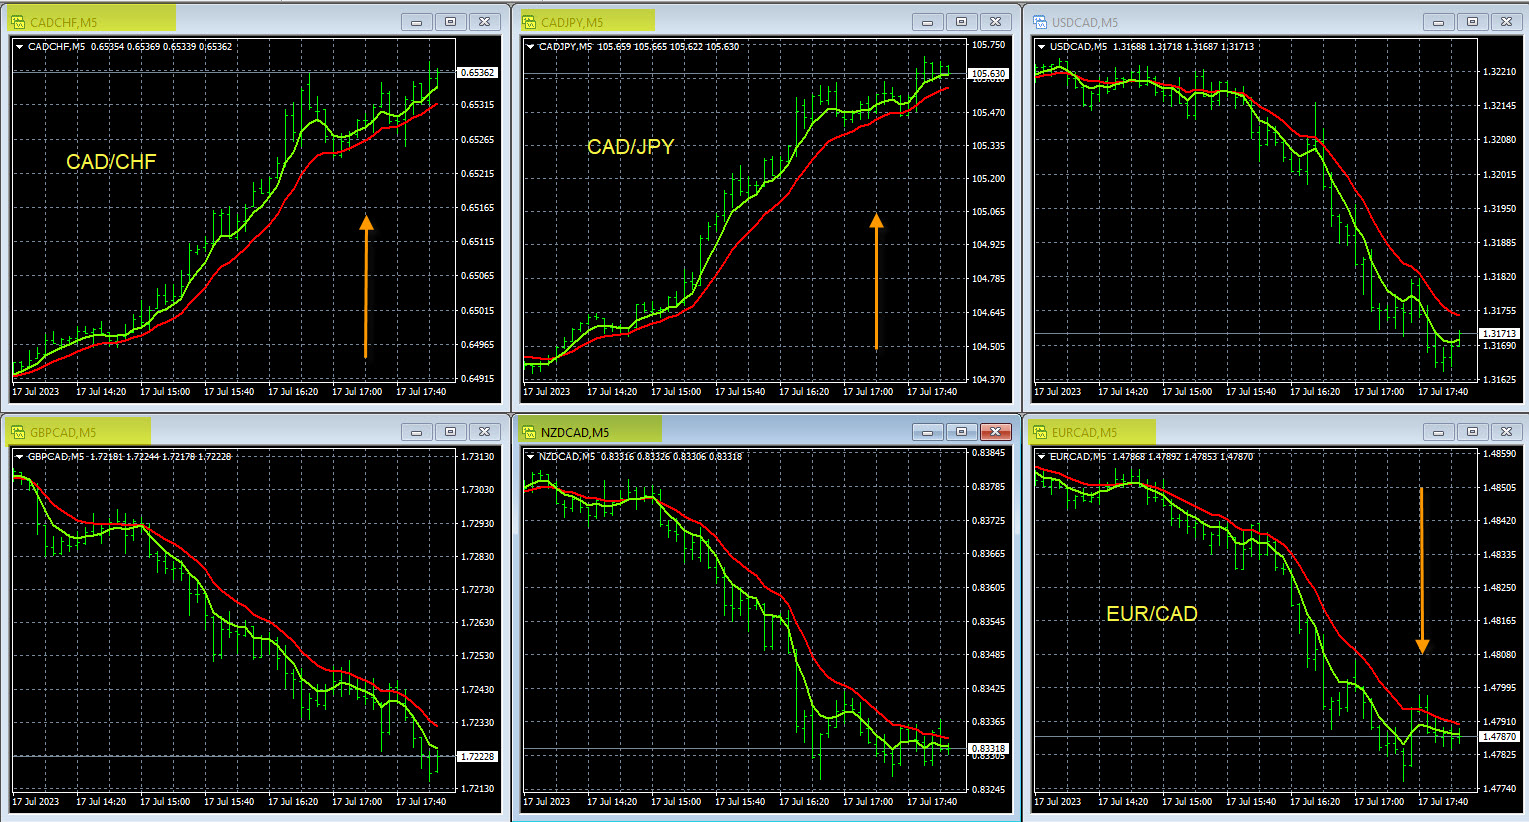
Same Time Frame On Multiple Pairs
Setting up your charts this way allows you to view any time frame on any group of pairs. So if you are a daytrader, swing trader or longer term trend traders this chart setup is suitable.
Daytraders use the smaller time frames like the M5 and M15 to monitor the intraday movements and to manage trade entries. If your trading style is swing trading, you can enter on the smaller time frames, then inspect the H4 time frame to see where you are in the overall H4 cycle.
Example Use Case For The Various Time Frames
Please refrence the CAD signals and price movements above. A trader gets a notification that the CAD is strong. They pull up their charts and heatmap and decide to sell the NZD/CAD. In this case they use the heatmap signals and smaller time frames to enter the trade. When the pairs stalls they move their stop to breakeven and scale out half of their lots. Then they inspect the D1 time frame and the trend is down with no nearby support, they decide to hold the NZD/CAD sell position for more trend based pips. This is a good illustration of how to use the various time frames for their intended purpose. No random trade entries or hold decisions. If the NZD/CAD hits strong support is not trending down on the larger time frames, the trader should exit the trade.
Best Pairs To Trade
Now that you know the best time frames to use and how to set up your charts, now here is a list of the best pairs to trade. Any combination of the top 8 most liquid currencies is good for this charting and time frame system. The top 8, most liquid currencies are the USD, CAD, EUR, GBP, CHF, JPY, AUD and NZD pairs. There is a total of 28 pairs.
As is the case for any new trading system or charting system, we ask all traders to demo trade this system and to be responsible. However you will be impressed with the way you are able to see the pips and movement cycles. You will no longer be a prisoner to the horrible technical indicators that almost all forex traders use every day. You will see that the daily movements in the forex market are caused by the strength and weakness of the individual currencies in each pair. Your entire vision of the forex market will change.
Summary and Conclusions About Forex Time Frames:
Forex traders often ask questions like: What is the best Time Frame To Use?, the answer is most likely all of them. The higher time frames and lower time frames can both be utilized to improve your market analysis and trade entries, all time frames play a role. Combine this with professional alert systems and signal systems presented here into a winning trading system.