- Categories
-
Recent Posts
- High Confidence Gold Trading System
- Fine Tuning Your Forex Trade Entries
- GBP/CHF, EUR/GBP Example Trade Entry
- Live Trading Capital: Funded Forex Account, Forex Funding
- Forex Mobile App On Telegram
- Forex Scanner, Real Time Screening Signals For 8 Currencies
- Forex Audio Book, MP3 Library
- Forex Trading Seminar — Can I Become A Forex Trader?
- GBP/JPY Trend Reversal
- Forexearlywarning, Introduction To Our Complete Trading System
Category Archives: Uncategorized
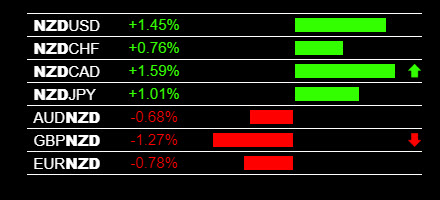
Forex Trading Signals NZD/CAD Sell
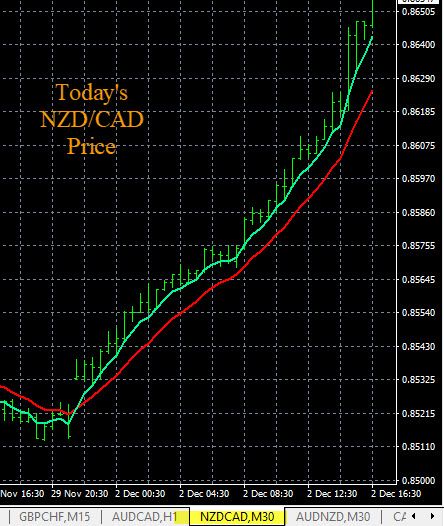
Today in forex trading the NZD/CAD had a sell signal on The Forex Heatmap®. The Canadian Dollar (CAD) was neutral to slightly strong and the NZD (New Zealand Dollar) was consistently weak. The NZD/CAD live sell signals are shown below. The NZD/CAD had a good price drop and should continue down for one more day to the next support at 0.8650 on the H4 time frame. So these downward movement cycles over the last two days are against the major trend. However, this pair will eventually reverse back to the upside since the W1 time frame uptrend is still in place.
Forex traders should scale out lots and take profit as this pair continues lower to 0.860. The NZD remains weak on the time frames and more weakness is expected until tomorrow. The trading signals you see are from The Forex Heatmap®, which provides live visual trading signals for 28 pairs and eight currency groups. We send push alerts to your desktop and cellphone to tell traders when the market is moving across 8 different currencies and 28 different pairs.
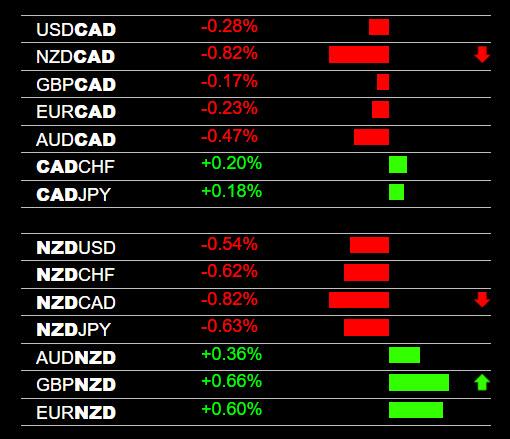
Forex Trading Signals NZD/CAD Sell
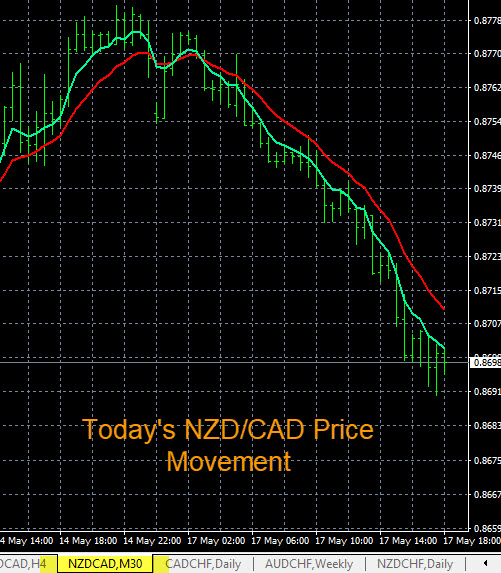
Forex Trading Signals NZD/CAD Chart
Posted in Uncategorized
USD/CAD Trend and Resistance Levels
The USD/CAD is trending higher on the D1 time frame. This pair also continued higher in the trend today as the USD was strong on most pairs. The current resistance levels are between 1.2525 and 1.2625. This area of resistance is layered and clustered together.
When the USD/CAD moved into this zone you should consider starting the exit any buy positions, This price cluster is about 65 pips above the current price levels. The forex trend indicators you see are 5/12 exponential moving averages set up on a meta trader platform.
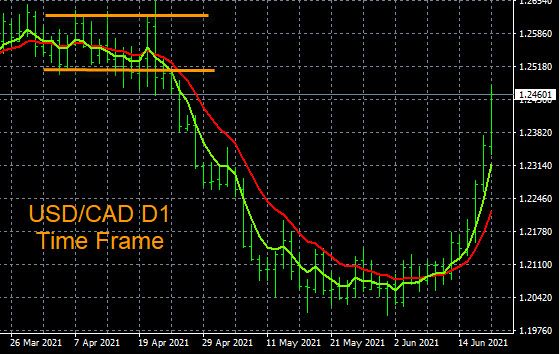
USD/CAD Trend, Resistance Levels
Posted in Uncategorized
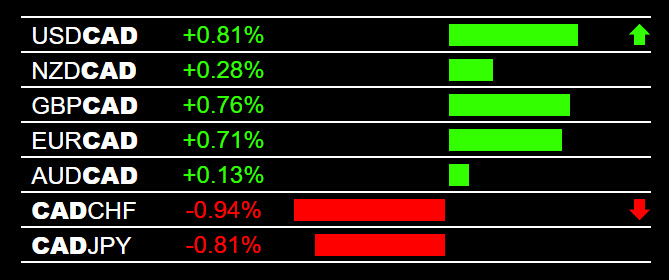
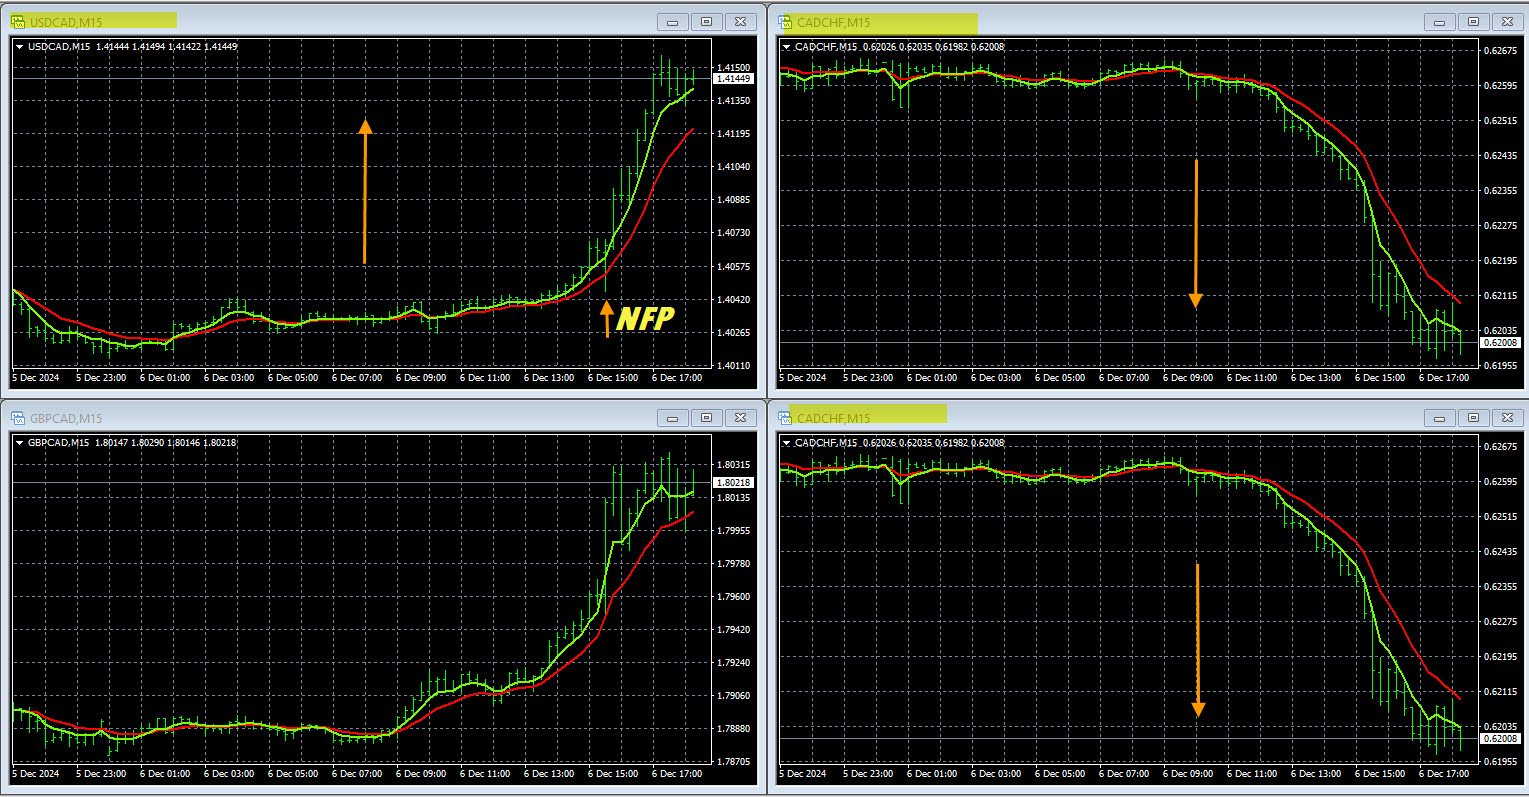
GBP/CAD Buy Signal
Today in forex trading the GBP/CAD had a buy signal on The Forex Heatmap® forex heatmap. The GBP (British Pound) weakness was consistent on all pairs. This pair is starting a new trend on the D1 time frame, so it has good pip potential upside going forward for several days. We will continue to plan additional buys on this pair in the upcoming trading plans, and we will treat this as a swing trade on the D1 time frame. So, along with the 150 pip movement cycle you see from today, more pips are possible in the direction of the trend. The heatmap can be used to enter short term day day trades or trend based trades on the higher time frames like the D1 or W1 time frames.
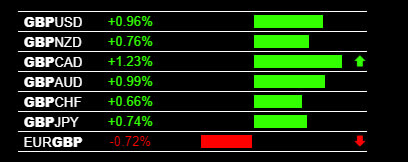
GBP/CAD Buy Signal
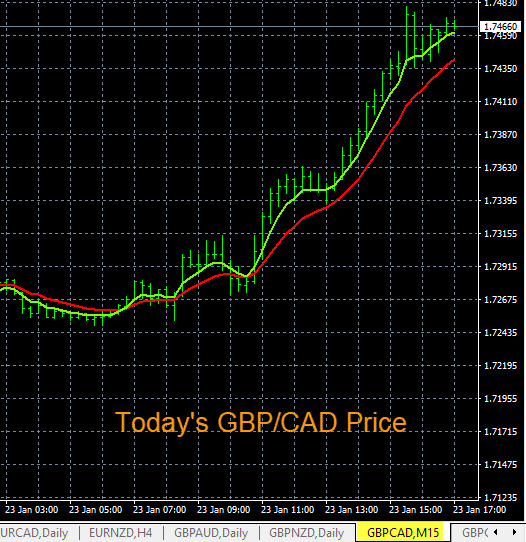
GBP/CAD Buy Signal Chart
Posted in Uncategorized
Live Forex Signals NZD/USD Buy
Today in forex trading The Forex Heatmap® forex heatmap, our live signal trading signal software, indicated a buy signal on the NZD/USD. A snapshot of the real time trading signal is shown below. The NZD was strong on all pairs and the USD had some weakness.
This pair moved strong to the upside and it broke some near term resistance levels. This pair could be forming a trend on the larger time frames, like the W1 time frame. Therefore, we will be looking to set more trading plans to buy this pair again going forward. This pair has considerable upside potential from here on the W1.
The heatmap provides live trading signals for 28 pairs and assists traders with verified trade entry points and improved profit management.
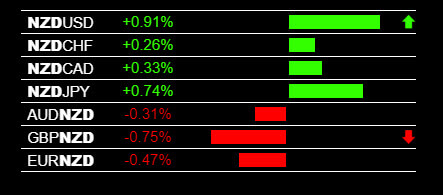
Live Forex Signals NZD/USD Buy
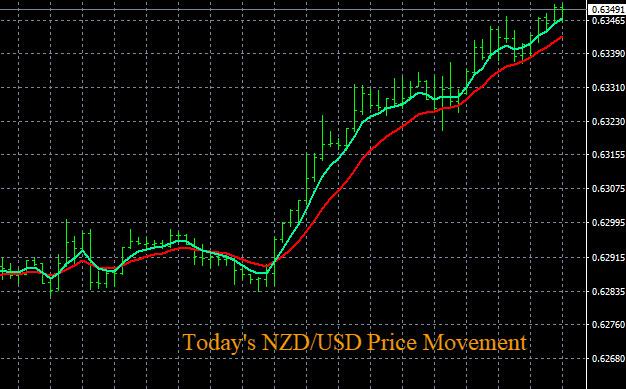
NZD/USD Buy Signal Chart
Posted in Uncategorized
GBP/USD D1 Time Frame Trend
This is an analysis of the GBP/USD on the D1 time frame. This pair is close to a full reversal on the D1 time frame and a new uptrend forming. Tomorrow morning in the main trading session there is USD Consumer Price Index news. This could drive volatility and price movement. If the USD is weak after the CPI news on The Forex Heatmap®, then consider a buy on this pair. If the D1 uptrend fully forms it has overall potential of over 400 pips. See yellow line notations on the charts. You can also set an audible price alert at 1.2330 to notify you and help to intercept the movement.
Any time a forex traders sees a new D1 uptrend forming on any of the major forex pairs, and also the exotic pairs, they should take note as getting into the trend at the beginning of the movement should be a priority, and your money management ratio will always be heavily in your favor.
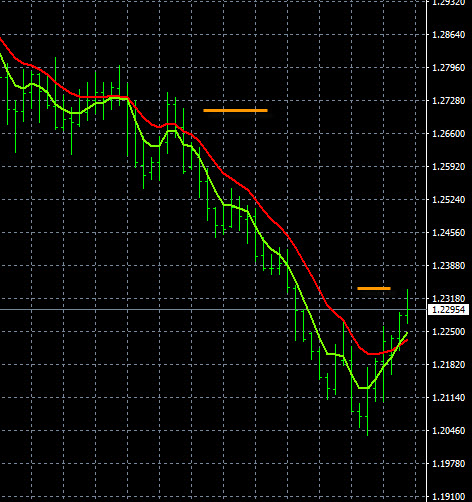
GBP/USD D1 Time Frame
Posted in Uncategorized
Forex Trade Signals NZD Strength
Today in forex trading the NZD (New Zealand Dollar) strength signals were evident on all pairs on The Forex Heatmap® forex heatmap. The NZD/CAD and NZD/USD both moved strong to the upside starting in the Asian session and moving higher overnight and into the main trading session. Both of these NZD pairs have established new D1 time frame uptrends. We expect both pairs to continue to move higher, after one retracement period.
The NZD/CAD and NZD/USD both moved up over 100 pips each, excellent price movement for traders to take advantage of. This momemtum based trading system and trend indicators will assist greatly at confirming your trade entry points across 28 pairs, not just the NZD pairs. The heatmap can be used for trend based trading, trading after the news, or unexpected price movements on the forex market. The heatmap is easy to read for all traders, even beginners.
Forex Trade Signals NZD Strength
Forex Trade Signals NZD/CAD Chart
Posted in Uncategorized
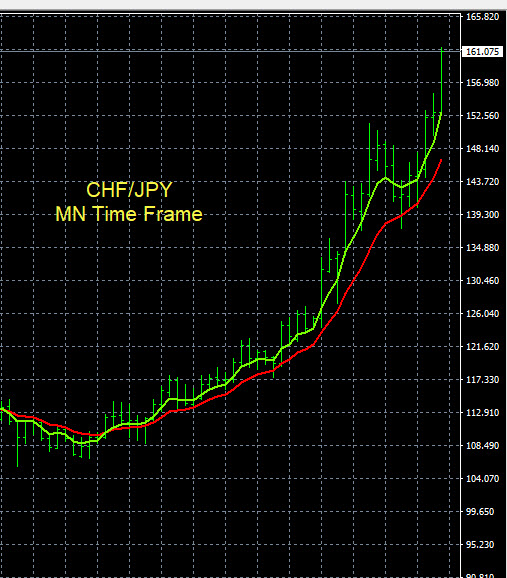
CHF/JPY Trend Analysis
This is the current trend analysis of the CHF/JPY on the largest time frames. This pair is trending higher on the MN time frame and has broken the 20 year resistance levels. It is at all time highs at the current pricing. If you enter a buy trade in the direction of the trend, trying to set a resistance target is not as simple because you have no visible target on your chart. In this case you can check the EUR/JPY, GBP/JPY, and USD/JPY resistance areas. If several of these pairs start to hit known resistance levels then the CHF/JPY will start to stall and form a resistance level also. Then you can scale out lots and manage the trade better with better profit taking procedures.
CHF/JPY Trend Analysis
Posted in Uncategorized
USD/CAD Chart Setup
Many forex traders talk about chart setups but never provide an example. A great chart setup is for any of the top 28 forex pairs or gold XAU/USD at the the beginning of the trend cycle. Here is a great example of a chart setup for the USD/CAD. This chart setup is on a larger time frame, in this case the W1 time frame.
Why is this a great chart setup? Because you are at the beginning of a larger trend cycle the reward to risk ratio is the highest. In this case we are using the W1 time frame, but the same principle applies to other time frames as long as it is the H1 time frame minimum. It depends on your trading style. At the beginning of the H4 time frame you would be considered a swing trader.
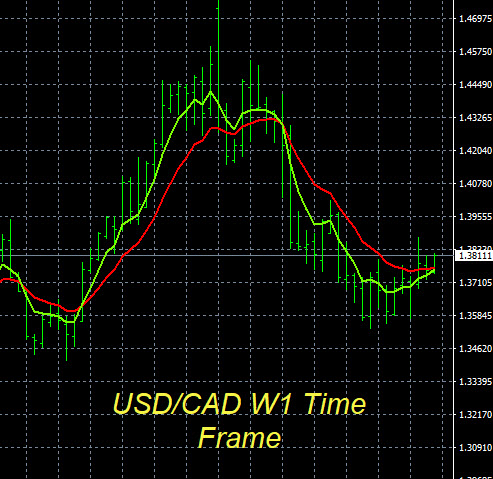
USDCAD Chart Setup
Now that you have the chart setup what do you do next ? Look for an entry point. Since we are talking about the USD/CAD you would look for consistent USD strength or CAD weakness or both on our heatmap tool.
Traders can set an audible price alert at the approximate upside breakout point of 1.3825. When the alert hits check out heatmap tool for a confirmed entry point. For the USD/CAD you would be looking for CAD weakness or USD strength or both in real time across the market.
CAD Weakness
CAD Charts
As the trade proceeds higher you would want to move move your stop order to breakeven and eventually start scaling out lots. Then ride the trend for as much as 12 weeks, which matches the previous cycle lengths. The upside potential past the price alert point of 1.3825 is over 400 pips. So the reward to risk ratio is more than 10:1 positive, which is outstanding for any trend based trade. You can find chart setups on 28 pairs like this and measure the reward to risk ratio on the H1, H4, D1 or W1 time frames before you take the trade.
Posted in Uncategorized
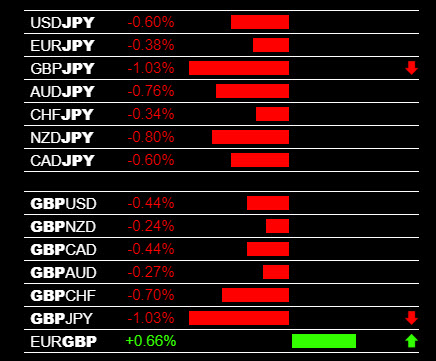
GBP/JPY Sell Signal
Today in the forex market the GBP/JPY had a sell signal on The Forex Heatmap® forex heatmap. This pair sold off strong to just above the 127.00 support level. We would scale out lots at these price levels, but it could continue lower and has additional room to drop on the H4 and D1 time frame to the next support level. The NZD/JPY also dropped today and this pair should continue down to at least the next major support level, and possibly much lower since this pair is also in a strong downtrend. The sell signal for the GBP/JPY is below, this is the Forex Heatmap®, it gives live trading signals for seven of the forex major pairs, and a total of 28 currency pairs.
You can see that the GBP (British Pound) was weak today and the JPY (Japanese Yen) had some strength, creating a scenario for a strong sell off on the GBP/JPY pair. This profitable trading system for 28 pairs is available from Forexearlywarning.com.
GBP/JPY Sell Signal
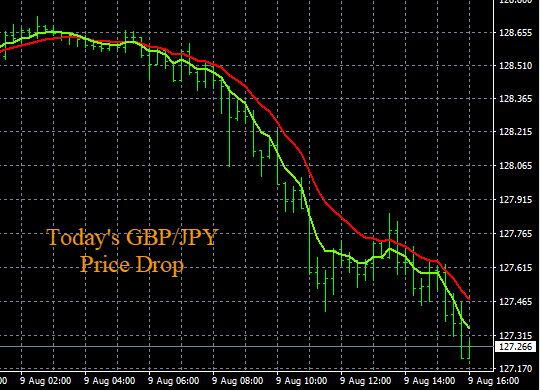
GBP/JPY Sell Signal Chart
Posted in Uncategorized
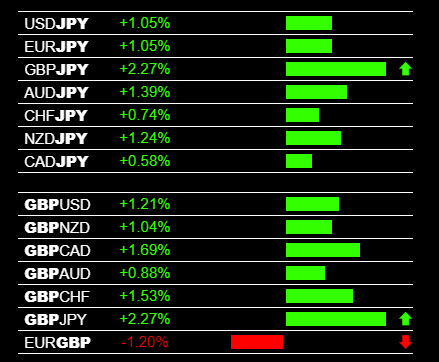
GBP/JPY Buy Signal
Today in forex trading the GBP/JPY had a buy signal on The Forex Heatmap® forex heatmap. This pair cycled up to the 131.25 area resistance, we would scale out some lots and manage profits at this resistance area. The GBP/USD also moved up strong and this pair has no nearby resistance, it should continue higher on the D1 time frame. Check the signals below, the GBP (British Pound) was strong on all 7 pairs and the JPY (Japanese Yen) was mostly weak. This creates conditions for strong movements on volatile pairs like the GBP/JPY. The Forex Heatmap® provides live buy and sell signals for 28 currency pairs. The heatmap is an important part of our trading system along with multiple time frame analysis, support and resistance levels, and trading with the trends on the higher time frames.
GBP/JPY Buy Signal
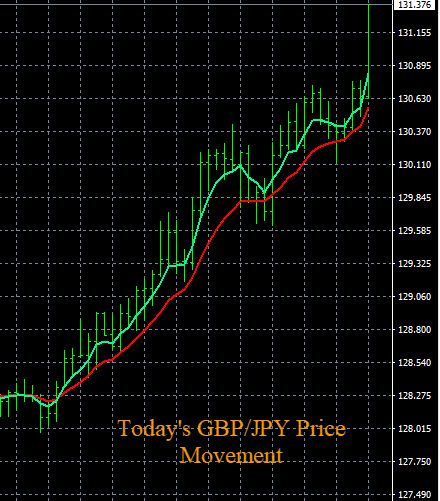
GBP/JPY Buy Signal Chart
Posted in Uncategorized