This is an analysis of the EUR/CHF trading charts using the D1 and H4 time frames, and the principles of multiple time frame analysis. With multiple time frames you always check the higher time frames first, then drill down to the smaller time frames for trade entry confirmation in the same direction.
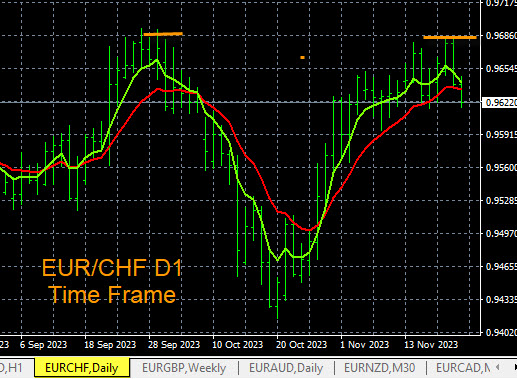
Forex Trading Charts EUR/CHF D1 Time Frame
Use these easy to set up exponential moving averages as your trend indicators for all nine (9) of the time frames, M1 to MN. In this case the D1 trend above is stalling at resistance. Traders should be looking for a new down trend to form on the D1, assisted by reading the smaller time frames like H4 and H1.
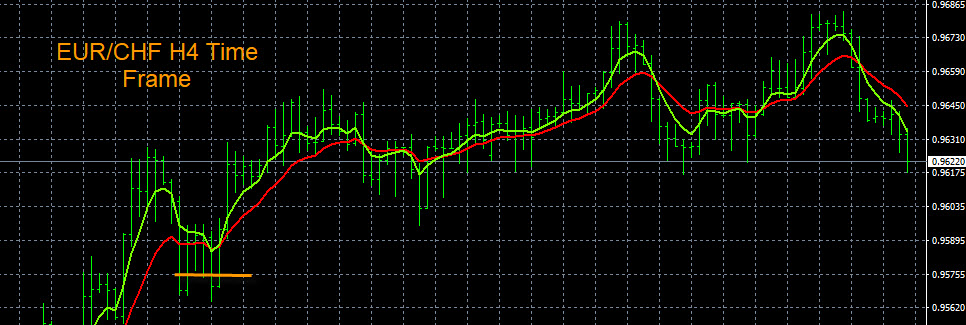
Forex Trading Charts EUR/CHF H4 Time Frame
You can see that the H4 time frame is now pointing down. So wait for the first breakout point to be breached at a price of 0.9570 on the EUR/CHF (yellow line), then you can look to sell this pair. When the price alert is breached make sure the EUR is weak or the CHF is strong, or both, using our visual tool called The Forex Heatmap ®. Below the 0.9570 breakout point this pair has lots of room to drop on the D1 cycle, so the money management ratio is excellent on this pair on the sell side.
Monitoring the support breakout point of 0.9570 is easy using audible price alerts. Then conform the sell with the heatmap to ensure your risk is low on entry. combines with trading in the direction of the trend.
If forex traders ues multiple time frame analysis consistently on the higher time frames, like the H4 and larger, they would have more success trading while avoiding choppy market conditions. Pairs like the EUR/CHF along with the top 28, most liquid pairs becomes a reality with these simple techniques.