- Categories
-
Recent Posts
- High Confidence Gold Trading System
- Fine Tuning Your Forex Trade Entries
- GBP/CHF, EUR/GBP Example Trade Entry
- Live Trading Capital: Funded Forex Account, Forex Funding
- Forex Mobile App On Telegram
- Forex Scanner, Real Time Screening Signals For 8 Currencies
- Forex Audio Book, MP3 Library
- Forex Trading Seminar — Can I Become A Forex Trader?
- GBP/JPY Trend Reversal
- Forexearlywarning, Introduction To Our Complete Trading System
Author Archives:
Bank Of England Interest Rate Cuts
Today in forex news the Bank of England interest rate was cut, dropping interest rates from 0.50% to 0.25%. The Monetary Policy Committee left the door open to more cuts going forward. The cut was widely anticipated in this post Brexit business environment. So today, August 4, 2016 is the first Bank of England rate cut in 7 years.
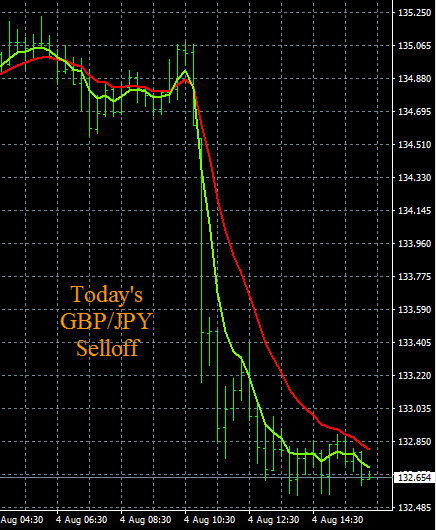
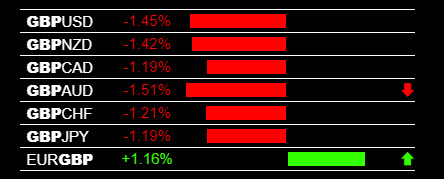
For forex traders, Bank of England interest rate news can cause strong movements and formation of new market trends of the British Pound against the other major currencies we follow. The British Pound dropped strong against all 7 currencies we follow after the news today. The GBP/USD is at an intra-day low of 1.8240 and the GBP/NZD had an intra-day low of 1.7750. Most GBP pairs we follow remain inside ranges and clusters, but the GBP/NZD and GBP/JPY have broken short term support levels. A chart of the GBP/JPY is shown below illustrating the the intra-day price movement of over 200 pips.
We expect more GBP pairs to follow and form trends based on GBP weakness. The long term trends on the MN time frame on all of the GBP pairs continues to show GBP weakness. Today’s live sell signals from The Forex Heatmap ® forex heatmap are shown below to show the GBP sell off, along with the price chart movement after the Bank of England news announcement today. We will look to continue writing trading plans to sell these pairs in our daily trading plans, as the trends are now in place.
Forex news drivers like like the Bank Of England interest rate decisions can be profitable events for forex traders. If traders have the proper trading system, signal system and know the direction of the trends on the GBP pairs, they can successfully trade forex news in the direction of the trend.
Bank Of England Interest Rates
Bank Of England Interest Rates
Sample Forex Trading Plan For One Group Of Pairs
In this video we will use one group of currency pairs to show traders how to build a sample forex trading plan for any pair in that group. These principles for building a trading plan work for any group of pairs with one common currency. Our example will be for the Japanese Yen (JPY) pairs. To prepare a trading plan for the JPY pairs you would drill down the charts using multiple time frame analysis. The AUD/JPY NZD/JPY, CAD/JPY, EUR/JPY, etc., all 7 JPY pairs total. In this example the long term trends on the higher time frames are all pointing down, and the H4 and D1 time frames are reversing back down into the trend, so the charts show that JPY is strong and that the JPY pairs are dropping. Our trading plans for this day reflect the JPY strength.
We prepare written trading plans for various JPY pairs along with the price alert points for traders to set audible price alerts to detect the movement to the downside. When the price alerts start to hit in the Asian session the JPY pairs are in an obvious sell off and our currency alert system also shows the sell off. This is a very safe way to trade the forex and this method works for all 8 groups of currency pairs we trade, i.e., USD pairs, CHF pairs, NZD pairs, etc., for a total of 28 pairs. Use the techniques in this video to prepare a sample forex trading plan for any group of pairs until you get more practice.
Forex Trades CHF Weakness
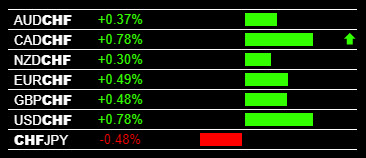
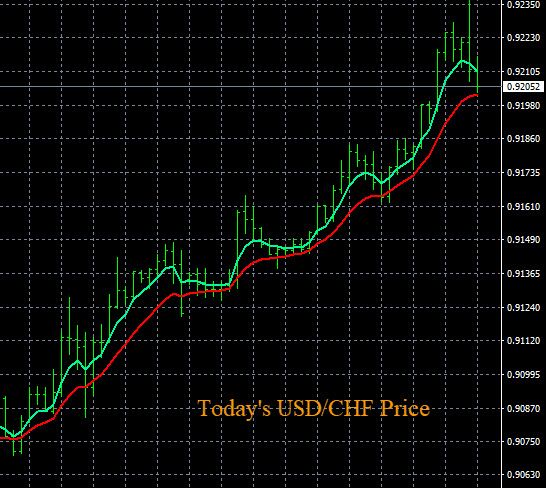
Today in the main forex trading session the CHF was weak on all pairs. The CAD and USD has a small amount of strength, so the USD/CHF and CAD/CHF had the strongest movements. The USD CHF is trending up on the D1 time frame, this pair has ongoing pip potential in the current uptrend cycle. Other CHF pairs like the CAD/CHF had nice movement today based on the CHF weakness in the market but this pair are inside of ranges and were short term buy trades or day trades.
The images below show the live CHF weakness trading signals from The Forex Heatmap® forex heatmap along with the associated price chart movement in the direction of the trends. Strong movements can occur with consistent signals in the main forex session and this is the best time to trade the forex.
CHF Weakness
CHF Weakness Chart USD/CHF
EUR/AUD Trend Analysis
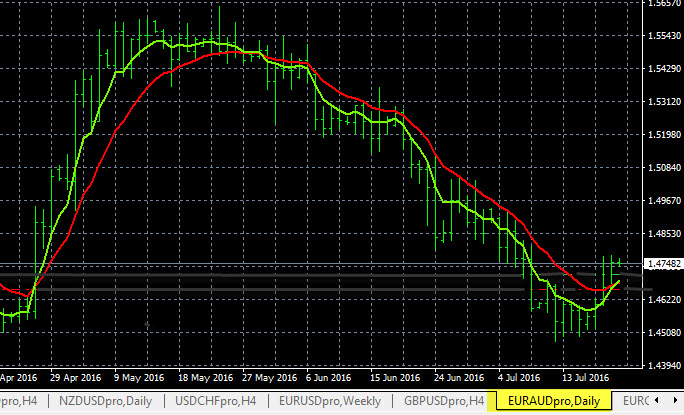
The EUR/AUD trend analysis is below. This pair is forming a new uptrend on the D1 time frame. Traders can set an audible buy alert at the 1.4775 level. The upside potential on this new trend is as high as the 1.5500 resistance level, so entering this trend has excellent upside potential. When the price alert hits check The Forex Heatmap® forex heatmap for trade entry verification signals.
The trend charts you see for the EUR/AUD are exponential moving averages which are easy to set up. These trend indicators can be used to follow the major trends of the forex market and our trend based trading plans. The chart pattern on this pair looks like a double bottom, which is a reversal pattern off of support, click on the link to learn more about this forex reversal pattern along with other forex trading patterns.
EUR/AUD Trend Analysis
Live Forex Signals GBP and JPY Pairs
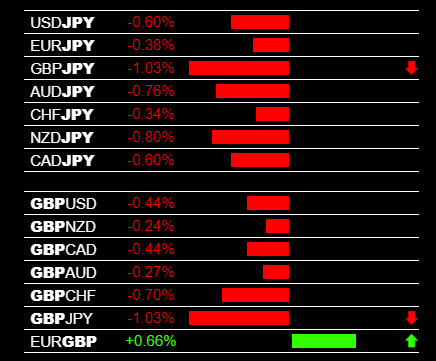
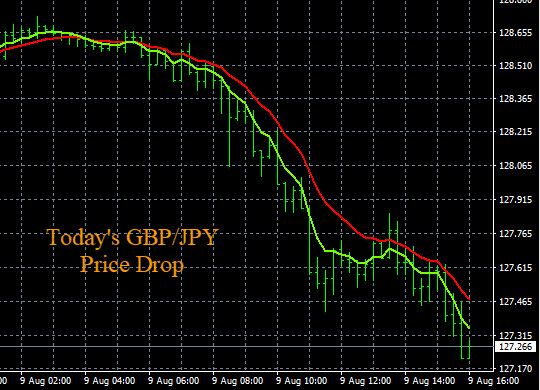
Today in forex trading the GBP (British Pound) was weak on across most pairs in the group and this drove strong price movement. The live trading signals for the GBP and JPY (Japanese Yen) pairs are shown below from The Forex Heatmap®. These are strong trading signals. The GBP/JPY had strong sell off and broke through short term support levels and into their long term trends. The NZD/JPY also sold off on the overall JPY strength in the market today. The GBP/JPY is in strong downtrends on the larger time frames like the W1. This pair is at post-Brexit lows, and the GBP/USD is at a multi year low. We see a lot more sell potential ahead on these pairs.
The Forex Heatmap® provides live buy and sell signals for 28 currency pairs. You can see the signals from the JPY and GBP pairs in the images below along with the nearly 125 pip sell off in the GBP/JPY. Forexearlywarning is a top notch trading services provider that traders look to for increasing their pip totals across 8 different currencies. We send push alerts to your cellphone when the market is moving across 8 currencies and 28 pairs.
Live Forex Signals GBP and JPY Pairs
Live Forex Signals GBP/JPY Chart
NZD/CHF Trend Analysis
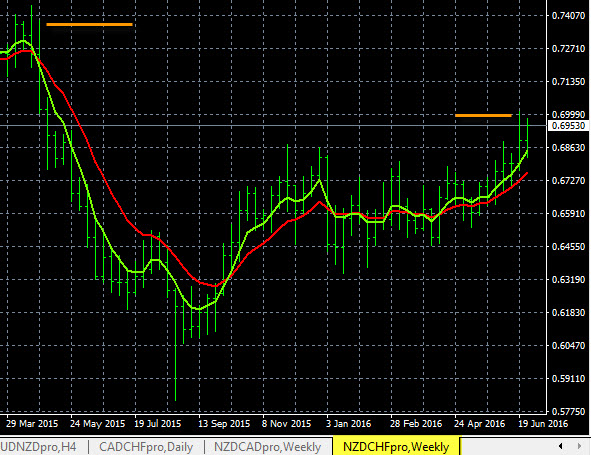
The NZD/CHF is trending higher on the W1 time frame. Traders can set a an audible buy alert at the 0.6985 resistance area, which is noted on the chart by the yellow line. This is the next resistance breakout point.
When the price alert hits price check The Forex Heatmap® for a confirmation buy signal. The NZD/CHF has great upside pip potential past the alert price up to the 0.7400 area resistance level, noted on the trend chart below. So the overall pip potential is about 400 pips, which means that the risk/reward ratio and money management ratio for this trade is excellent. We conduct all of our trend analysis using multiple time frames of trends. We isolate each currency like the NZD and CHF plus six other currencies and analyze them separately to develop trend based trading plans for 28 pairs..
NZD/CHF Trend Analysis
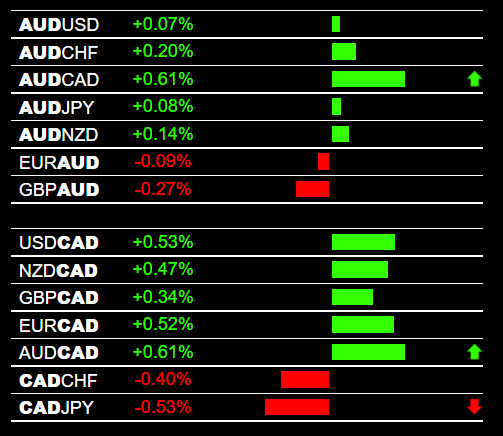
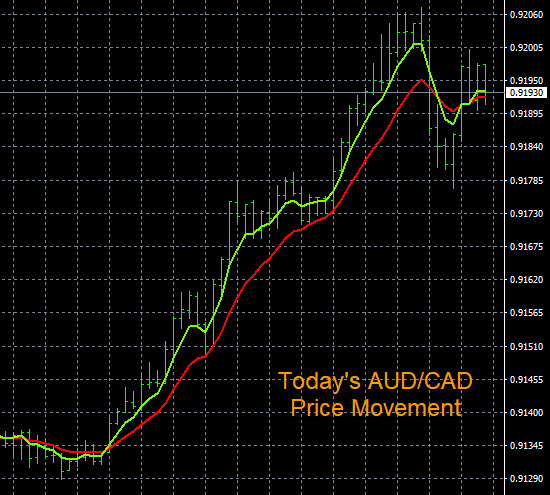
Forex Trade Signals AUD/CAD Buy
Today in forex trading the CAD (Canadian Dollar) was weak, the AUD/CAD had a buy signal and moved higher. The AUD/CAD had a strong overnight movement and has broken one resistance level on the W1 uptrend. This pair has additional upside potential on the W1 time frame trend. We will look to continue to write additional trading plans for buys over the next few days.
The AUD/CAD has hit a high of 0.9200 in intra day trading. The live forex signals you see below are from The Forex Heatmap® forex heatmap, which provides live buy and sell signals for 28 currency pairs. These signals are more accurate and succinct than any other free or paid signals available to traders for trading the forex market. Traders can use the heatmap signals plus the smaller time frames to enter short term trades or exting trends on the higher time frames, like the H4 or D1. The heatmap gives traders guided trade entry points for trending pairs and day trades. We send push alerts to your cellphone so you know when the market is moving across 8 different currencies.
AUD/CAD Trade Signals
AUD/CAD Chart
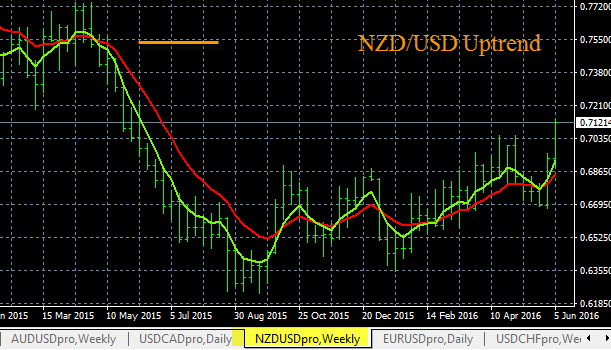
NZD/USD Trading Plan
Here is our current trading plan for the NZD/USD pair. The NZD was strong in the Asian session today so after this pair consolidates, we will set an audible price alert for a buy at the near term resistance, just past 0.7130. See the W1 time frame chart below. When the price alert hits check The Forex Heatmap® forex heatmap for a confirmation buy signal.
The W1 time frame uptrend shown below indicates that the current pricing is around 0.7120, overall pip potential is up to the next major resistance at 0.7550, shown on the chart. This is about 400 pips of upside potential, so the money management ratio is excellent on this trading plan since we are using the higher time frames. So the forex money management strategies like risk reward ratio is always going to be favorable when using the higher time frames. We suspect we will be issuing several trading plans based on NZD strength for the other NZD pairs we follow tomorrow in our daily trading plans.
NZD/USD Trading Plan
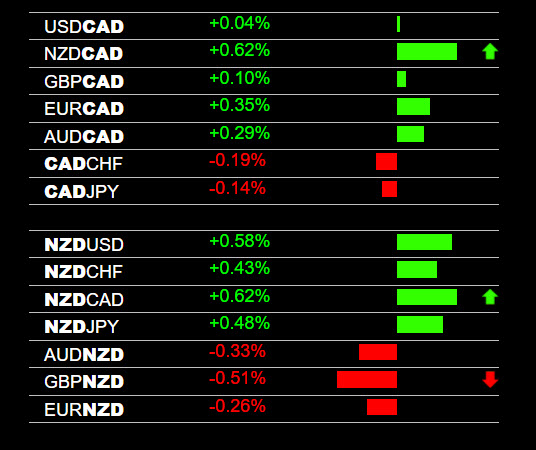
NZD/CAD Buy Signal
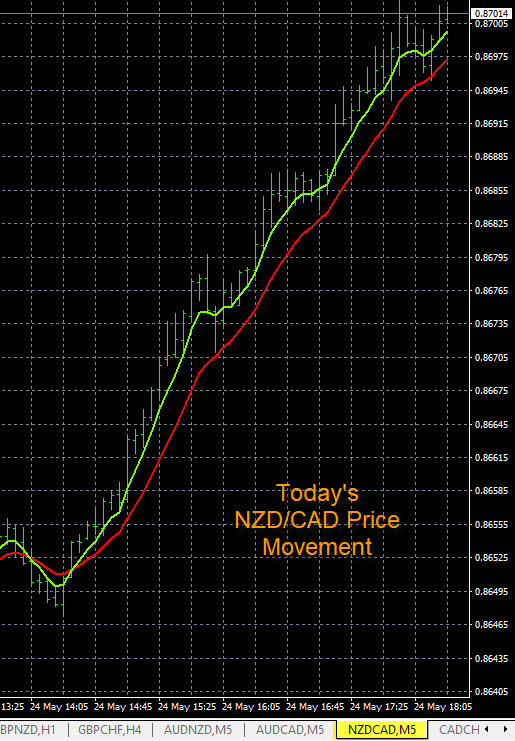
Today in forex trading the NZD/CAD had a strong buy signal and movement to the upside. The live buy signal from The Forex Heatmap® is shown below in the images, along with the strong intraday price movement. The NZD (New Zealand Dollar) was strong on all pairs today, driving a lot of movement on the pairs in this currency group. This pair is ranging on the smaller time frames, and it should continue up to the 0.8750 resistance area.
Check the intraday movement cycles in the chart below. Today’s movements were strong but the NZD/CAD pair is not in an uptrend on the higher time frames, it is ranging, so we are setting the 0.8750 resistance price target. The signals you see below from the heatmap work very well for profitable trade entries across 28 pairs, including 7 major pairs, and 21 lower spread exotic currency pairs like the NZD/CAD.
NZD/CAD Buy Signal
NZD/CAD Chart
Forex Trade Charts GBP/USD Trend Analysis
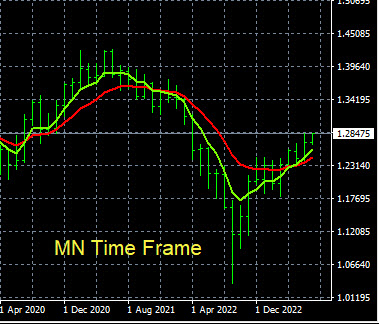
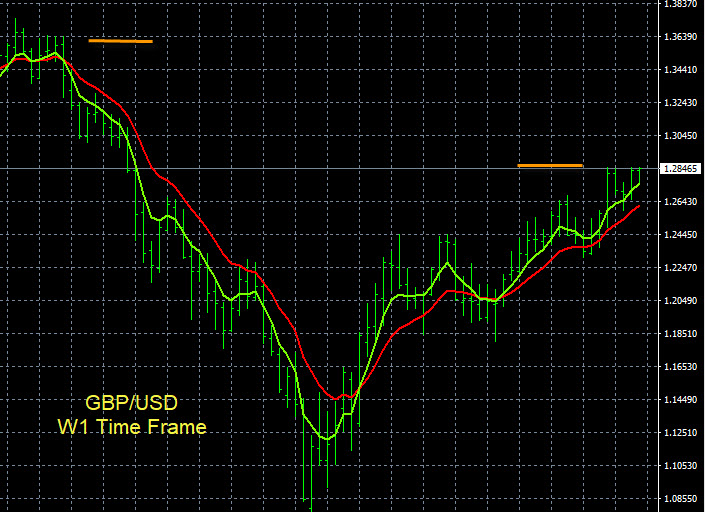
The GBP/USD trend analysis is presented below. This is the chart of the GBP/USD on the W1 and MN time frames. This MN time frame trend is still new and at the beginning of the cycle and has plenty of upside potential. Traders should set an audible buy alert at 1.2850 on this pair, noted by the yellow line. When the alert hits check The Forex Heatmap® forex heatmap for a confirmation buy signal.
Since the MN time frame uptrend is still at the early stages, the upside potential is up to the 1.3640 resistance, or possibly higher. The GBP is strong on all pairs right now based on an analysis if the trends by individual currency. Also, there are GBP (British Pound) and USD (US Dollar) news drivers tomorrow morning in the main session, so this trend could continue building tomorrow in the main forex trading session, which is one of the best times to trade the forex market. The W1 time frame is also presented, which magnifies the W1 trend so you can see the breakout points and targets much better.
These trade charts are easy to set up for all 28 pairs and the chart analysis techniques are available at Forexearlywarning.com for any trader.
Forex Trade Charts GBP/USD MN
Forex Trade Charts GBP/USD W1