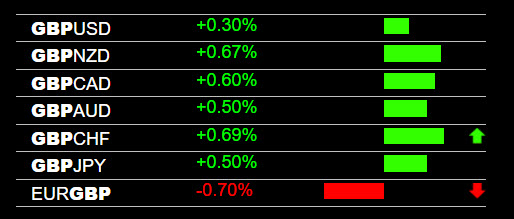
Here are some forex trend charts for the EUR/GBP on various time frames. We will use them to prepare a forecast forecast for the EUR/GBP currency pair movements over the next few days. The EUR/GBP dropped in todays trading. The drop was due to the GBP strength you see on our live indicator. The Forex Heatmap forex heatmap. The EUR/GBP dropped today and is headed for a bigger support level on the H4 time frame. at 0.8550. Our forecast is that the EUR/GBP will drop to this support level, then traders should exit any sell positions. In 1 to 2 days this pair will reverse back up into its normal range seen on the H4 time frame chart below.
Forex Trend Charts EUR/GBP
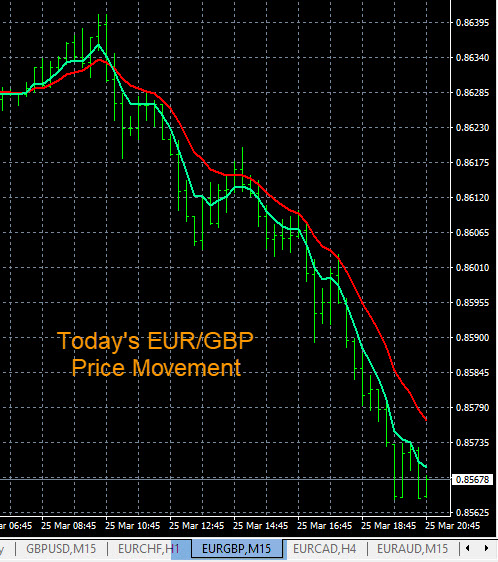
Forex Trend Charts EUR/GBP Intraday Movement
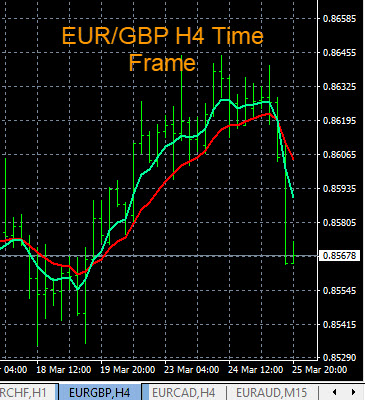
EUR/GBP Forecast H4 Time Frame
The red and green lines you see on the charts you see are some easy to set up forex trend indicators Traders can set the trend indicators up by individual currency. In this case you can set up all of the GBP pairs together, so you can see how the EUR/GBP is moving for your trade entries. Traders can perform their overall market analysis using multiple time frames across each individual currency for enhanced accuracy.
Use these handy links to learn how to analyze support and resistance levels on the smaller and larger time frames, and for more options for setting up your trending indicators metatrader setup options for market analysis. If you have the right analysis tools set up by individual currency you can successfully trade the EUR/GBP, other GBP pairs, or make forecasts.