The forex trend indicators and analysis of the EUR/JPY trends are shown below. This is the W1 time frame. Traders can set a price alert at 128.20 for a support breakout, see the yellow line. Below that price when the alert hits confirm any sell trade entries with The Forex Heatmap® forex heatmap. The target support area area is would be the 126.00 support area, shown by the bottom yellow line. This is great pip potential of 180 pips, which is usually the case when analyzing trends on the higher time frames.
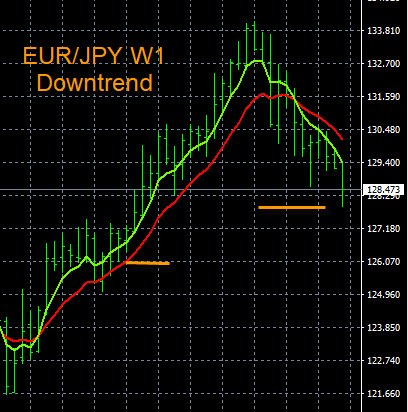
Forex Trend Indicators EUR/JPY
The forex trend indicators we use are 5/12 exponential moving averages. You can set them up on any charting platform, and the above image shows traders how they look on the metatrader platform. Following the trends and ranging currency pairs on the forex market is our basic market analysis technique, using multiple time frames by individual currency. We prefer the higher time frames, H4 and larger, but occasionally traders using our system can drop down to the H1 time frame.
When the moving averages indicate a trend or potential trend, we use The Forex Heatmap® to confirm any buy or sell entry. Then we can use support and resistance levels to assist with things like profit taking and price targets. Setting up these simple trend indicators only takes about a minute for each pair, and you should set up these indicators for all 28 pairs we follow. Once the trend indicators are set up, traders can set audible price alerts to notify them of any price movement so they know it is time to check the EUR/JPY signals on the heatmap. This same technique works on all of the pairs we trade.
We also have a forex video library on our website that show you various options for setting up these indicators, grouped by individual currency.