Many forex traders talk about chart setups but never provide an example. A great chart setup is for any of the top 28 forex pairs or gold XAU/USD at the the beginning of the trend cycle. Here is a great example of a chart setup for the USD/CAD. This chart setup is on a larger time frame, in this case the W1 time frame.
Why is this a great chart setup? Because you are at the beginning of a larger trend cycle the reward to risk ratio is the highest. In this case we are using the W1 time frame, but the same principle applies to other time frames as long as it is the H1 time frame minimum. It depends on your trading style. At the beginning of the H4 time frame you would be considered a swing trader.
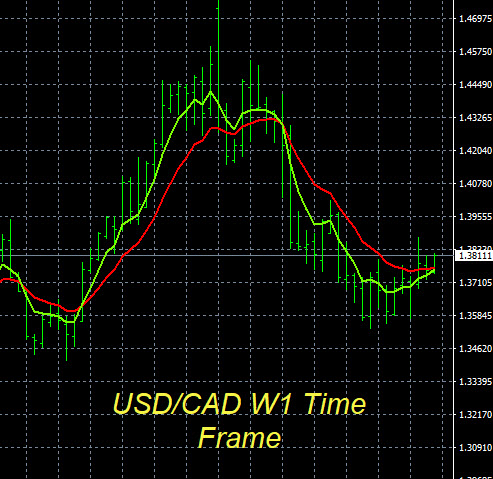
USDCAD Chart Setup
Now that you have the chart setup what do you do next ? Look for an entry point. Since we are talking about the USD/CAD you would look for consistent USD strength or CAD weakness or both on our heatmap tool.
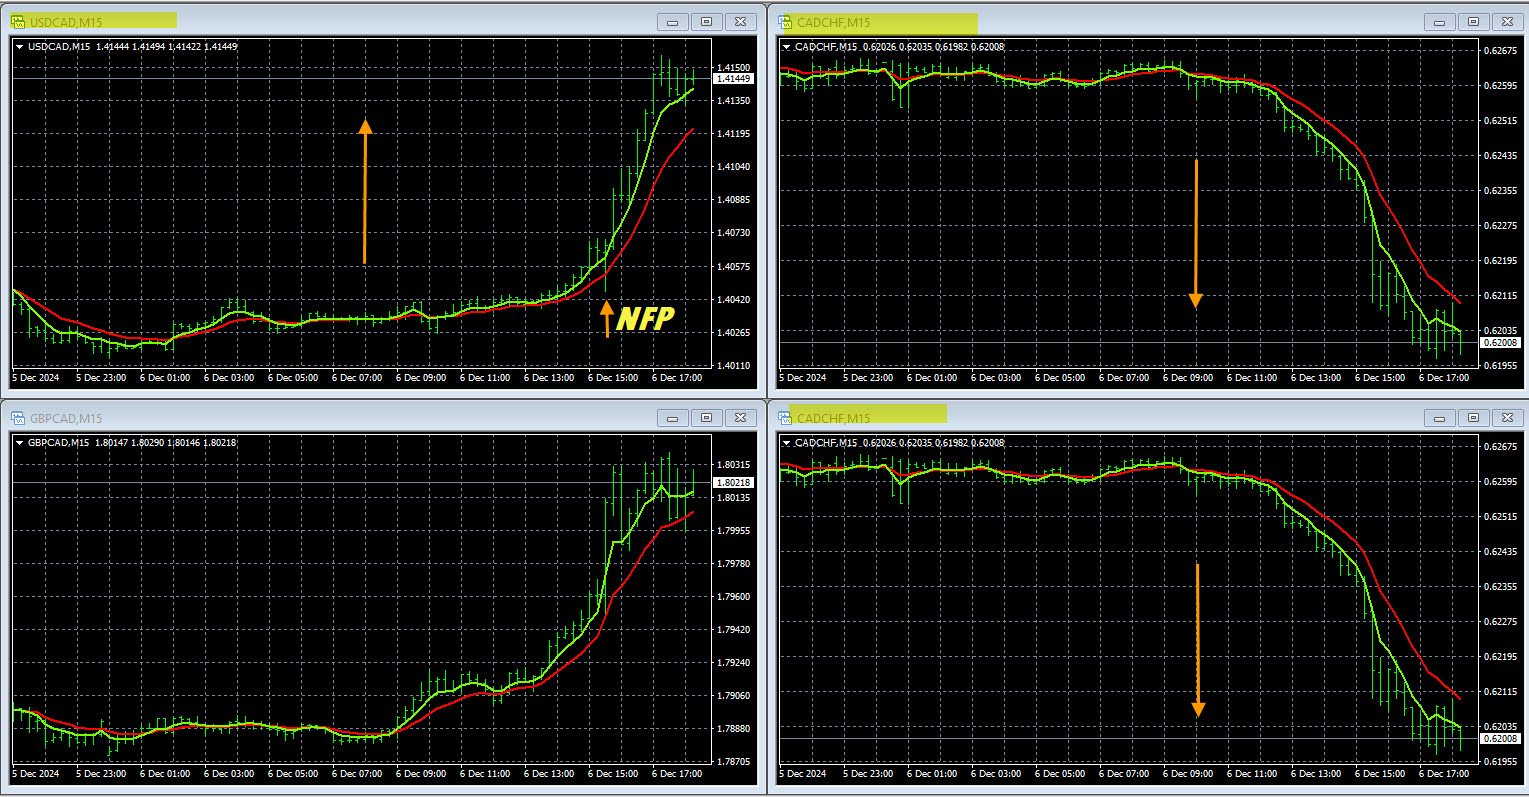
Traders can set an audible price alert at the approximate upside breakout point of 1.3825. When the alert hits check out heatmap tool for a confirmed entry point. For the USD/CAD you would be looking for CAD weakness or USD strength or both in real time across the market.
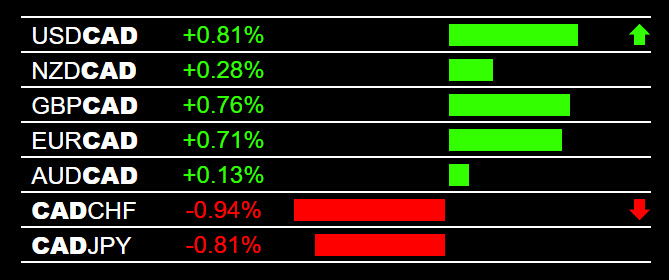
CAD Weakness
CAD Charts
As the trade proceeds higher you would want to move move your stop order to breakeven and eventually start scaling out lots. Then ride the trend for as much as 12 weeks, which matches the previous cycle lengths. The upside potential past the price alert point of 1.3825 is over 400 pips. So the reward to risk ratio is more than 10:1 positive, which is outstanding for any trend based trade. You can find chart setups on 28 pairs like this and measure the reward to risk ratio on the H1, H4, D1 or W1 time frames before you take the trade.