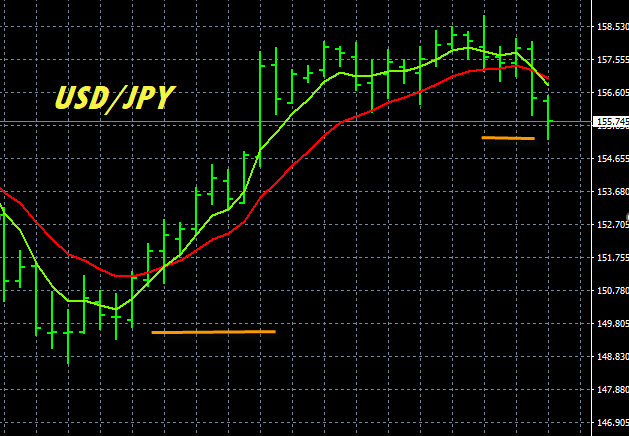
The USD/JPY chart and trend analysis illustrates how impacful a new trend can be for profitable forex trading. Pictured below is the USD/JPY chart at the beginner of a downtrend on the D1 time frame. Any time you see a trend cycle starting on the D1 time frame you are well positioned for a great forex trade with lots of upside potential.
As a trader getting into a trend near the beginning give you much stronger money management ratio, and the money management ratio is measurable. Pip potential is around 570 pips, so the money management ratio is 19:1, positive, which is excellent, assuming a 30 pip stop on any sell entry. Most forex traders cant come close to this type of ratio, but these chart situations occcur with relative frequency. Current price of 155.70 down to 150.00 area support is 570 pips. Getting into forex trades at the beginning of the movement cycle on almost any time frame will be beneficial, especially the bigger time frames like the D1. Traders should always be looking for fresh trend cycles on the H1, H4 or D1 time frames when trading. Know what trading style you are using.
When you find a great chart setup like this how does the trader confirm the sell entry? You can either confirm the sell with JPY strength or USD weakness, or both. Confirming trade entries with currency strength is very reliable. Our tool called The Forex Heatmap ® will provide the trade entry guidance, in this case the JPY strength providing the entry confirmation.
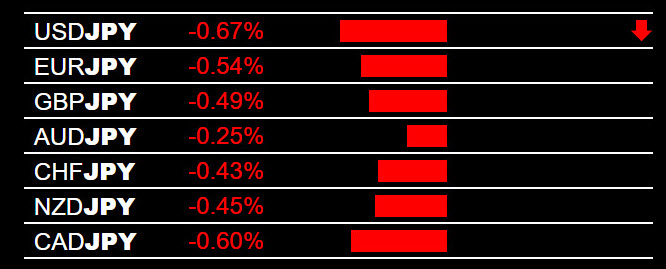
USDJPY Sell Signal
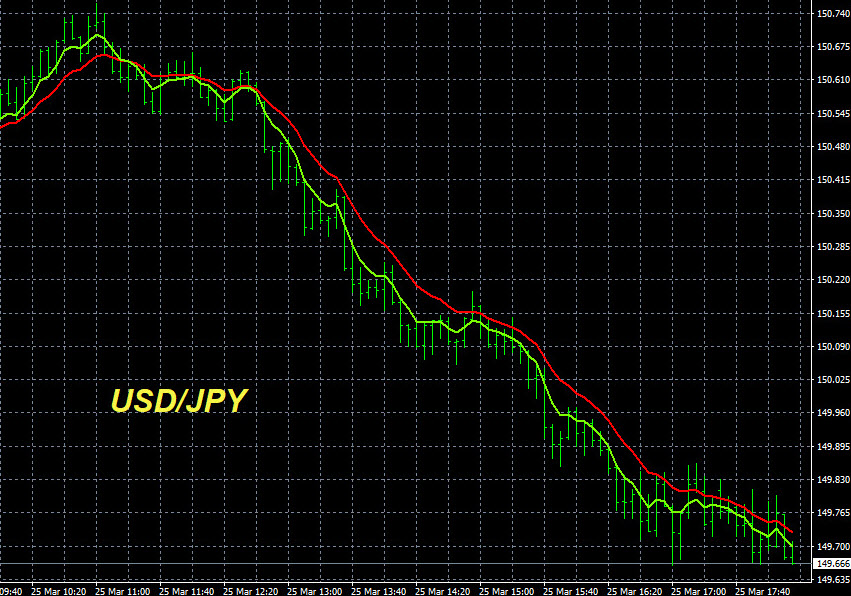
USDJPY Price Drop
Excellent intraday price drop to enter the trend. Now the trader is in complete control of the trade. They can scale out lots on any sells, move stop to breakeven, and continue to ride the newly fomed D1 downtrend for more trend based pips. Very powerful.
Now you can analyze USD and JPY pairs with our market analysis spreadsheet to determine what is driving the movement. USD weakness or JPY strength. Clearly, JPY strength drove the intraday movement as shown by our heatmap tool.