Heatmaps visually represent large amounts of data, graphically. A heatmap is a graphical representation of data that uses a system of color-coding to represent different values. Heatmaps are used in various forms of analytics, to visualize large quantities of data. Data visualization reduces the time needed to make decisions by observing a color coded, 2 dimensional map. They have wide applications in various business, science and financial markets. Here is one example:
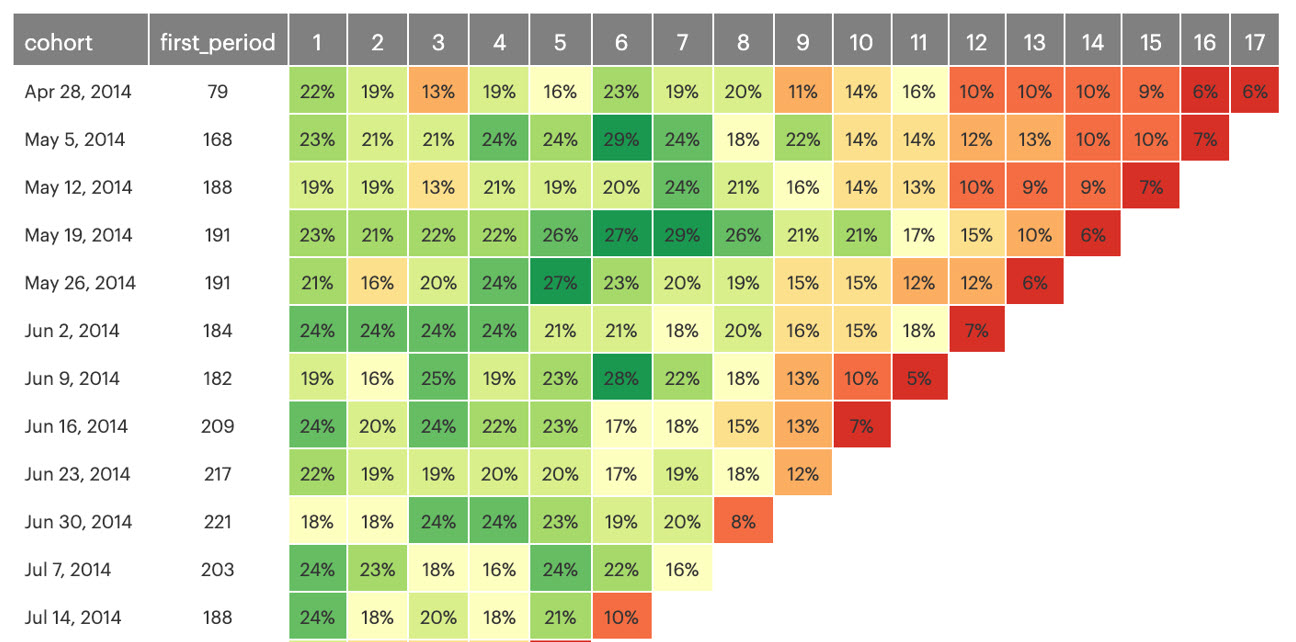
Data Heatmap
Heatmap Applications and Data Analysis
Heatmap applications are wide and varied. They can be used for things like website analytics (pages visits, link clicks, mobile app clicks, etc), mapping, biology, meteorology, frequency and number of occurrences of events, risk assessment, sales statistics by geographic region, demographics, hardware systems status, etc. The number of applications seems endless. An example temperature data heatmap is shown below:
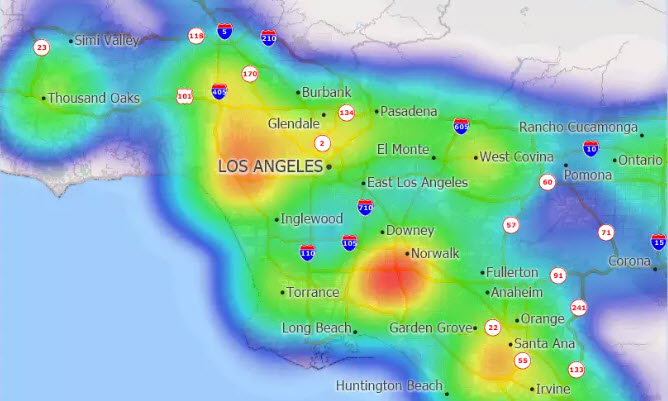
Data Heatmap
Financial Heatmap Applications
Heatmap applications to financial data are numerous. Financial maps are usually two dimensional color coded grids. These market map grids show performance or price movement of stocks, stock sectors, regional or worldwide stocks, bonds, currencies, interest rates, etc. They summarize large quantities of pricing data across different delayed time periods, or sometimes in real time.
This financial heatmap is called The Forex Heatmap®. It is a tool for forex traders that summarizes real time pricing data for currencies and converts the data into a convenient visual map. The above image is for the British Pound pairs. This map summarizes the real time pricing data for the GBP pairs along with 7 other currencies. Real time analysis of the forex, gold XAU and crypto currency pricing provides financial traders with a pre-programmed, web based, plug and play tool for quick determination of what pair or crypto currency to trade for profitable currency trading. When combined with a matching charting system profitable forex and gold trading is possible on a consistent basis. This is a real time financial heatmap:
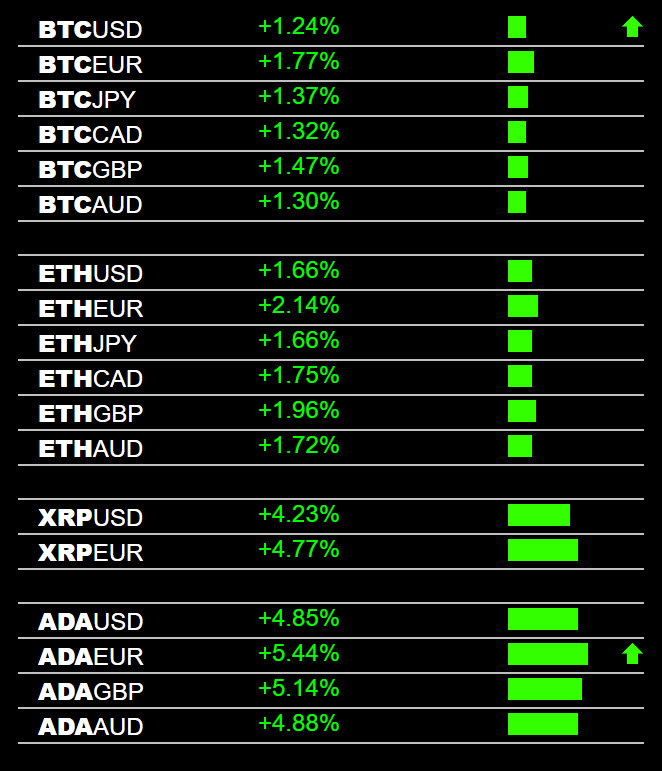
Crypto Currencies Heatmap
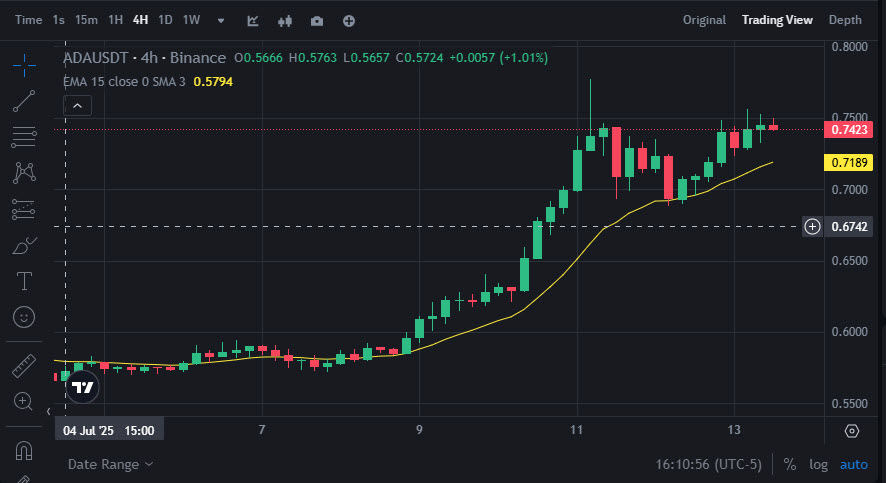
ADA Cardano Chart
Conclusions about heatmap applications: Heatmap applications are broad. These visual maps allow the end users to get the full story on almost any type of data with less interpretation. Heatmaps will provide tremendous insight to the data and allowing better decision making.