This forex market analysis spreadsheet will provide any amateur or professional forex trader a clear and repeatable method for analyzing 8 currencies and 28 pairs. The spreadsheet allows traders to break down the 28 pairs into 8 individual currencies to identify strong and weak currencies, plus other characteristics. Forex traders who have struggled in the past will now have a full understanding of what currencies and pairs are moving and trending, day after day, without layers of technical indicators.
This forex market analysis spreadsheet can be filled out manually fairly quickly for one individual currency, 7 pairs total. For example you can analyze the USD pairs quickly with this spreadsheet (USD/JPY, USD/CHF, USD/CAD, AUD/USD, etc.) Then you can repeat the process on any of top 8 currencies using the same procedures. The spreadsheet combines multiple time frame analysis with individual currency analysis so the trader can get a total handle on the current market conditions. It is truly the most thorough and professional method of forex market analysis, and far superior to any forex technical analysis indicators. We use the spreadsheet for the USD, CAD, EUR, GBP, CHF, JPY, AUD and NZD currencies.
Before downloading the forex market analysis spreadsheet, make sure you have installed the metatrader or other forex charting platform and set up the forex trend indicators that we provide to all forex traders and clients. Rearrange the pairs and group the pairs by individual currency. Now you are ready to download the spreadsheet and start analyzing the market.
Download The Spreadsheet
Download the Spreadsheet Using Microsoft Excel – The forex market analysis spreadsheet is a Macro Enabled Excel sheet for use with Microsoft Office version 2007 or newer. Microsoft Excel is not forex market analysis software, it is spreadsheet software that we have adapted for our market analysis method. Click on the link to the right and the analysis spreadsheet will download into your local hard drive. Then if you click on it, it will display on the screen in any browser, you can then save it to your hard drive if you wish. The first time you open the spreadsheet document you will have to enable Macros. This is usually a button near the top of the sheet that’s says “enable content”.
If you do not have spreadsheet software such as Microsoft Excel or Apple Number, there are a number of free spreadsheet softwares available. If you have a Gmail email address, you also have access to Google Sheets.
Fill Out The Forex Market Analysis Spreadsheet
To fill out the spreadsheet, arrange the 28 currency pairs in the order of listed on the sheet. See the example below for the USD pairs. Start with the EUR/USD, then the GBP/USD, AUD/USD, etc.
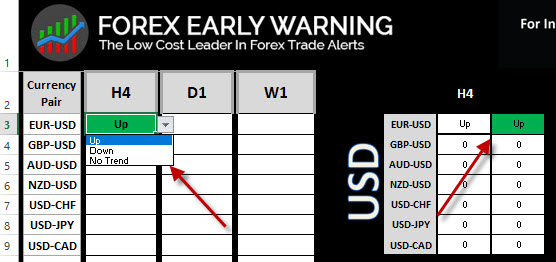
Forex Market Analysis Spreadsheet
Forex Market Analysis Spreadsheet – USD
There are three time frames on the spreadsheet, the H4, D1 and W1 time frames. You are now going to list the trend direction on the H4, D1, and W1 time frames for each currency pair, by individual currency. In the image above you can see the USD pairs listed for an analysis of the USD pairs. Under each of the three time frame you will be given 3 options on the drop down menu:
1) Up = Uptrend 2) Down = Downtrend, or 3) No trend.
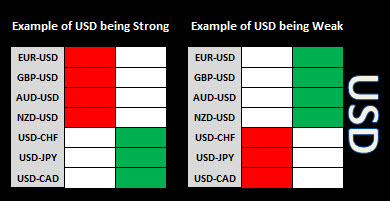
Once you fill out the direction of the 3 time frames for each currency pair, you can visually see if the same time frame or many time frames are lining up in the same direction on one currency. You can now see at a glance if the USD is strong or weak on one or more of the major time frames.
Forex Market Analysis Spreadsheet USD
Then you can repeat the process for all 8 currencies we track, and 28 pairs total. It is possible that the market can have mixed signals, and it is also possible that one currency can be consistently strong or weak on just one of the three major time frames. The more consistent the trends in one direction, the better your chances of trading successfully. Knowing the condition of the overall forex market eludes most forex traders, but this professional analysis spreadsheet will help them to see the market much clearer. Then preparing daily trading plans becomes much easier.
Traders that want to learn how to properly fill out the forex market analysis spreadsheet and analyze the forex market can also watch this currency analysis spreadsheet video that shows a complete example of analyzing one currency. The example will explain to any trader how to fill out the sheet sheet under real market conditions. This will help traders to start filling out the sheet on their own and how to understand the results. Our youtube library has a playlist with 4 more examples of how to fill out the spreadsheet for the AUD, USD, NZD and JPY pairs. So 5 examples total for different currencies.
Overview Of The Forex Market Analysis Spreadsheet
The forex market analysis spreadsheet is broken into 2 areas. The first area on the left is a list of 28 pairs with the 3 major time frames listed. There are drop down boxes in each time frame that allow you to identify and fill in the trends. You simply identify the trends for the 3 major time frames in all 28 pairs in groups with one common currency.
This information auto populates the second area on the (right side). This area consists of grids that represent individual currencies. There is a guide on the far right of these grids which you use to compare to see if there is consistent individual currency strength or weakness. These individual currency grids and guides are set up to look somewhat similar to The Forex Heatmap® forex heatmap. This will aid in the visual recognition of the alignment of the individual currency strength and weakness analysis of the charts/overall market. We use The Forex Heatmap® for our trade entry management. By conducting a daily forex market analysis this way, the analytical method we use matches the trade entry methods we use, so everything in our trading system is consistent.
Practicing Forex Market Analysis
Every week we put the forex market analysis spreadsheet into action during our Monday night webinars. We show you how to use the spreadsheet and practice analyzing the market on one currency during our live forex webinars. Any forex trader can join us for these webinars to see how we analyze the market to prepare our daily trading plans. These webinars are audio and video recorded and archived, in case you are unable to attend live.
Spreadsheet Fundamentals, Individual Currencies Versus Pairs
Every currency pair consists of two separate currencies, each currency has different properties. For example the EUR/USD has the EUR is an individual currency and the USD is an individual currency. You trade the pair but you must analyze the two currencies separately before trading this pair or any pair. Most traders look at the pair but do not separate the currencies for analysis. You must separate them in order to find the individual currency strength or weakness, plus other characteristice, to give you the best possible overall market analysis, and individual pair analysis.
To analyze the EUR individual currency you must analyze all seven major currency pairs with the EUR on the left. When you evaluate all the seven pairs containing the EUR and analyze them you can discover whether the EUR individual currency is strong, weak, neutral or mixed. This can become a little challenging to keep track of when you are new to parallel and inverse analysis. That is where the spreadsheet becomes very handy. Just by providing the trends on the 28 pairs on 3 time frames, it will automatically “Separate” the currency pairs information into the individual currencies and provide a simple visual map of the forex that looks somewhat similar to The Forex Heatmap®.
The spreadsheet simplifies forex analysis of pairs or the overall market using parallel and inverse pairs for any level of forex trader, beginners or pros. This simple spreadsheet it will make you feel like a forex market analysis veteran and you will know whether the individual currencies in the market are strong weak, or mixed. You will have more information than 95% of all forex traders do, plus traders can create a consistent, repeatable approach in your forex market analysis today, tomorrow and every day. After you are finished filling out the spreadsheet you can easily figure out what pairs have a higher probability of continuing their trends, and you can write a trading plan for those pairs or manage exiting trades, accordingly.
When Is The Best Time To Fill Out The Spreadsheet
The best time to fill out the spreadsheet is ahead of the main trading session or late on the Asian session. Or about the same time we send out our evening USA time trading plans. Then you will be ready for the market movements in the main session. If you intend on trading news drivers in the Asian session you should fill it out again just ahead of the Asian session. PRO TIP>>> If one currency is strong on the spreadsheet, find a weak currency on the heatmap in the main session and you should have a great trade in front of you !
Another Forex Market Analysis Tool
The Forex Heamap® forex heatmap analyzes the forex market in real time and it has a similar look and arrangement as the market analysis spreadsheet. They should look the same, doing it this way makes our trading system consistent and highly logical. Our trade entry management tool matches the spreadsheet analytical method.
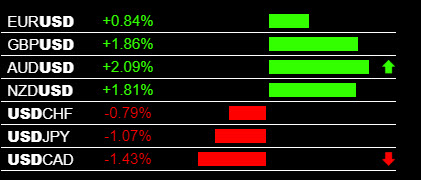
Forex Market Analysis Heatmap
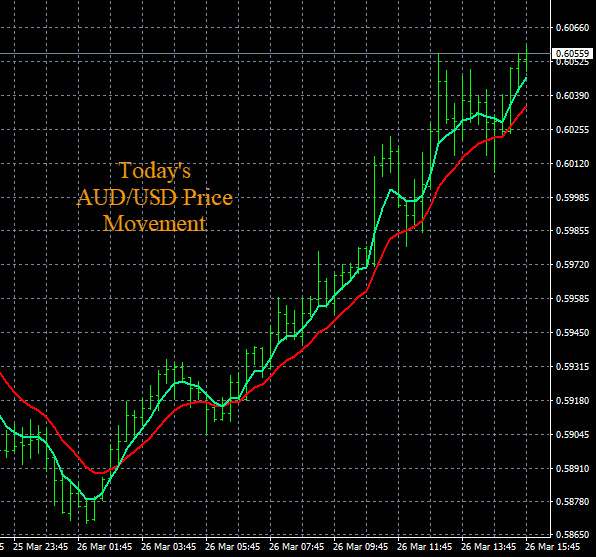
Forex Market Analysis Price Chart
When the heatmap signals are consistent you can get very strong movements in one trading session. When the market analysis spreadsheet is consistent on the trends, the forex market is much easier to trade. When you combine the two you now have the most logical and consistent method to analyze the forex maret, and also the best method of entering trades safely across 28 different pairs.